
With industrial production slightly under consensus (0% vs. 0.1% m/m), we have the following picture of key indicators followed by the NBER’s Business Cycle Dating Committee (with heaviest weight on nonfarm payroll employment and personal income excluding transfers).
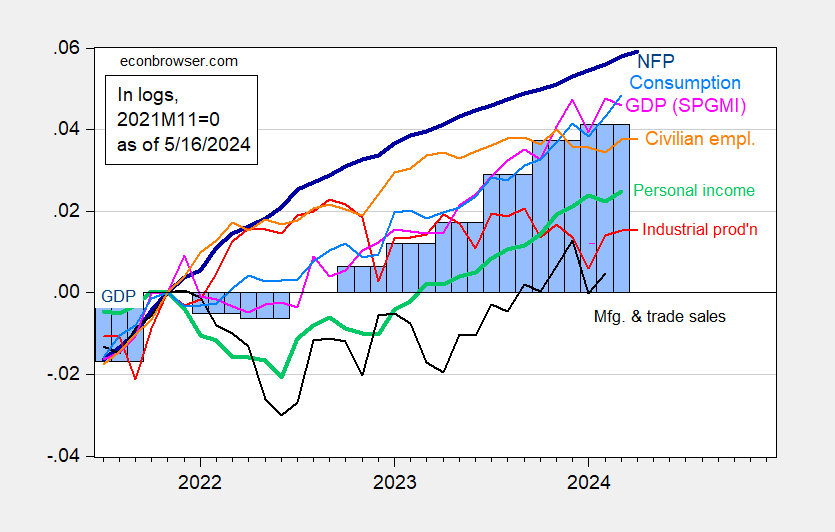
Figure 1: Nonfarm Payroll (NFP) employment from CES (bold blue), civilian employment (orange), industrial production (red), personal income excluding current transfers in Ch.2017$ (bold green), manufacturing and trade sales in Ch.2017$ (black), consumption in Ch.2017$ (light blue), and monthly GDP in Ch.2017$ (pink), GDP, 3rd release (blue bars), all log normalized to 2021M11=0. Source: BLS via FRED, Federal Reserve, BEA 2024Q1 advance release, S&P Global Market Insights (nee Macroeconomic Advisers, IHS Markit) (5/1/2024 release), and author’s calculations.
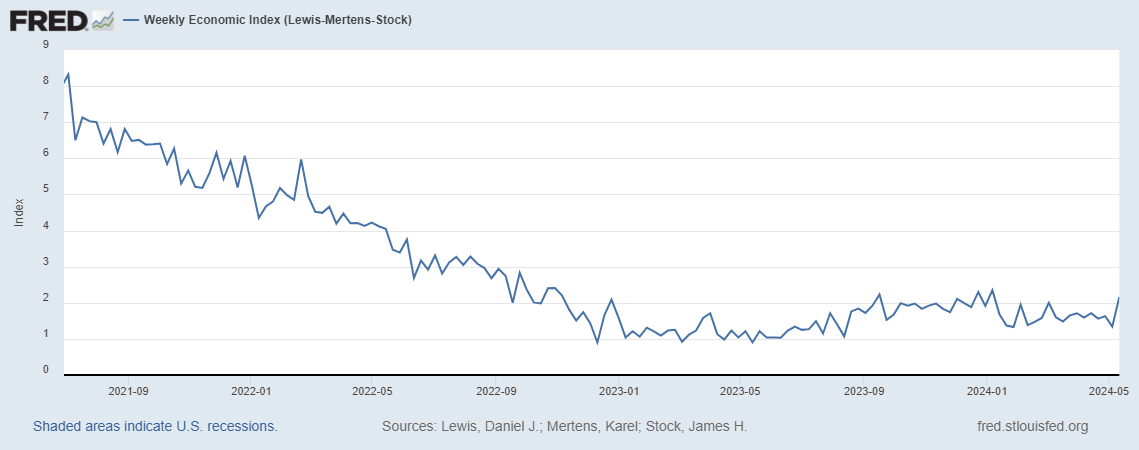
The latest Weekly Economic Indicators (for releases through May 11) indicates a jump above 2% (my guess of trend), to 2.16%.
More By This Author:
The Trend Break In CPISix Measures Of Consumer Prices
Grocery Prices Decline


Comments
Log in or sign up to join the conversation.