
Industrial production declined 0.1% m/m, vs. Bloomberg consensus +0.2. NFP employment rose in October strongly. Other key indicators followed by NBER Business Cycle Dating Committee.
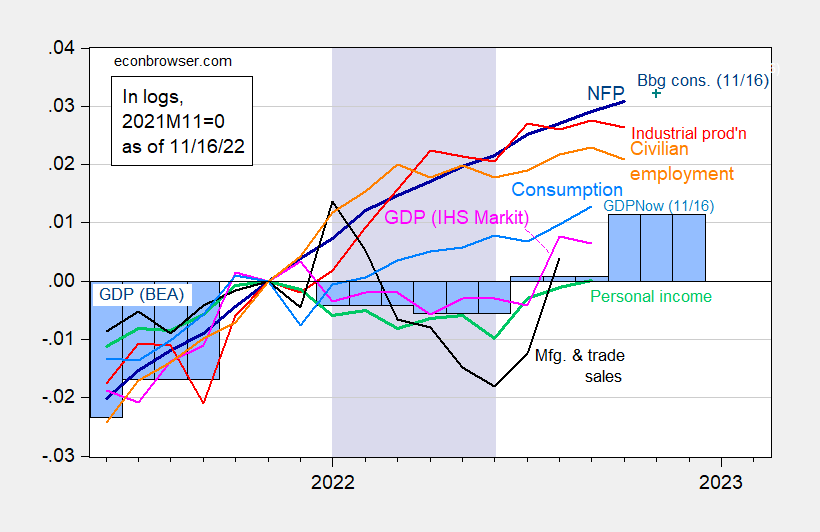
Figure 1: Nonfarm payroll employment, NFP (dark blue), Bloomberg consensus as of 11/16 (blue +), civilian employment (orange), industrial production (red), personal income excluding transfers in Ch.2012$ (green), manufacturing and trade sales in Ch.2012$ (black), consumption in Ch.2012$ (light blue), and monthly GDP in Ch.2012$ (pink), GDP (blue bars), all log normalized to 2021M11=0. Q3 GDP is from GDPNow for 11/16. Lilac shading denotes a hypothetical recession in 2022H1. Source: BLS, Federal Reserve, BEA, via FRED, IHS Markit (nee Macroeconomic Advisers) (11/1/2022 release), GDPNow (11/16) and author’s calculations.
While industrial production declined, and manufacturing production rose only 0.1% vs. 0.2% m/m consensus, retail sales far exceeded expectations.
GDPNow as of today is for 4.382% q/q SAAR in Q4. Given the likely revisions in GDP and the evolution of GDO, it seems unlikely (still) to me that a recession occurred in 2022H1. A recession in 2023 however, seems likely given yield curve inversions and other predictors.
More By This Author:
The GDP Outlook: Nowcast Vs. ForecastCPI Inflation Below Expectations – Markets Respond
Real Median Weekly Earnings: CPI Vs. Chained CPI


Comments
Log in or sign up to join the conversation.