

With the industrial production release showing an upside surprise (0.5% m/m vs -0.1 consensus) due to an outsized manufacturing increase (1% vs. 0.1% consensus), this is the picture of the series the NBER Business Cycle Dating Committee (BCDC), plus monthly GDP from S&P Global Market Intelligence (SPGMI) formerly Macroeconomic Advisers.
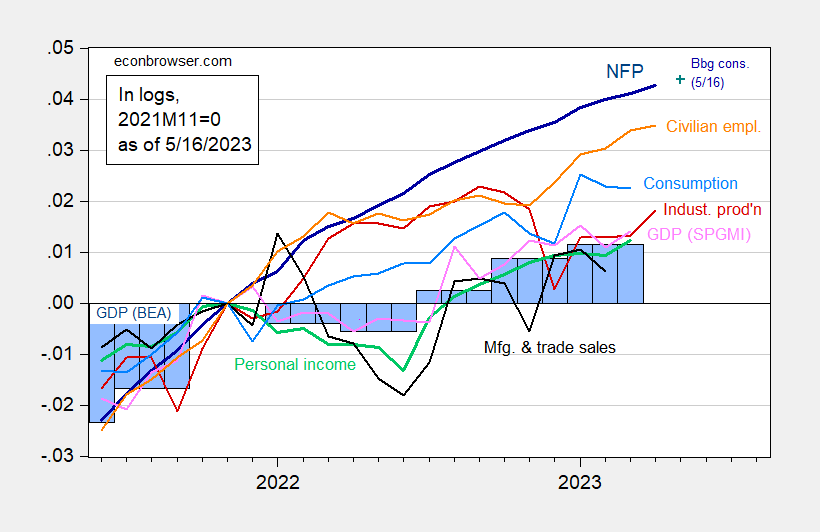
Figure 1: Nonfarm payroll employment, NFP (dark blue), Bloomberg consensus of 5/16 (blue +), civilian employment (orange), industrial production (red), personal income excluding transfers in Ch.2012$ (green), manufacturing and trade sales in Ch.2012$ (black), consumption in Ch.2012$ (light blue), and monthly GDP in Ch.2012$ (pink), GDP (blue bars), all log normalized to 2021M11=0. Bloomberg consensus level calculated by adding forecasted change to previous unrevised level of employment available at time of forecast. Source: BLS, Federal Reserve, BEA 2023Q1 advance release via FRED, S&P Global/IHS Markit (nee Macroeconomic Advisers, IHS Markit) (5/1/2023 release), and author’s calculations.
It’s interesting to consider the evolution of two other indicators of the broad state of the economy: GDP+ and the Philadelphia Fed’s coincident index for the US.
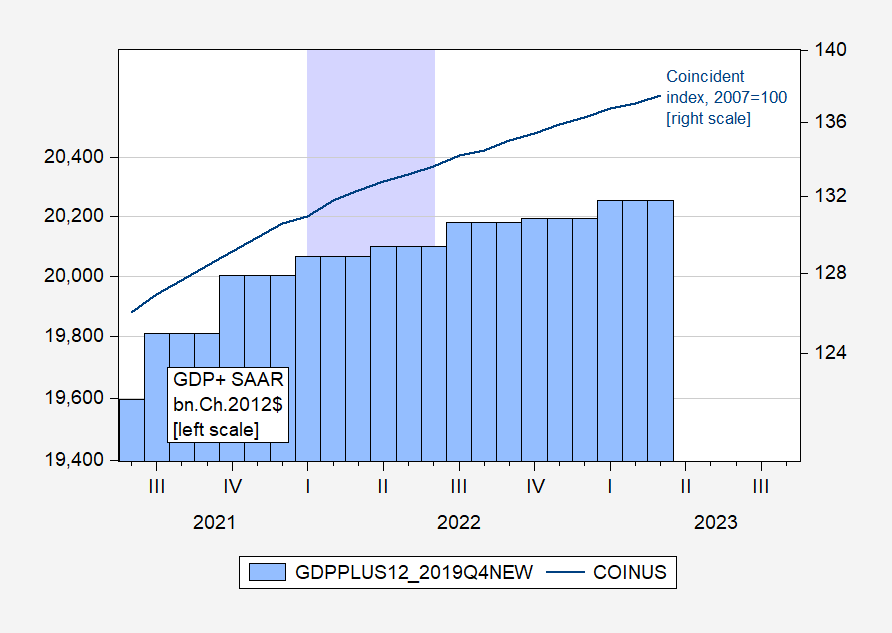
Figure 2: GDP+, scaled to 2019Q4, in bn.Ch.2012$ SAAR (blue bars, left log scale), and coincident index (blue, right log scale). Lilac shading denotes a putative 2022H1 recession. Source: Philadelphia Fed and Philadelphia Fed.
Interestingly, GDP+ and the coincident index (the latter based mostly on labor market indicators) did not indicate a recession in 2022H1.
More By This Author:
Oil, Risk, And Price Pressures Before Putin/Ukraine – Using The Hamilton FilterOil, Risk, And Price Pressures Before Putin/Ukraine
Real Median And Average Earnings, Normalized To NBER Peak


Comments
Log in or sign up to join the conversation.