
Business Cycle Indicators As Of Mid-January 2022
Industrial production comes in below consensus (-0.1% vs. Bloomberg +0.3% m/m). Here are some key indicators followed by the NBER BCDC.
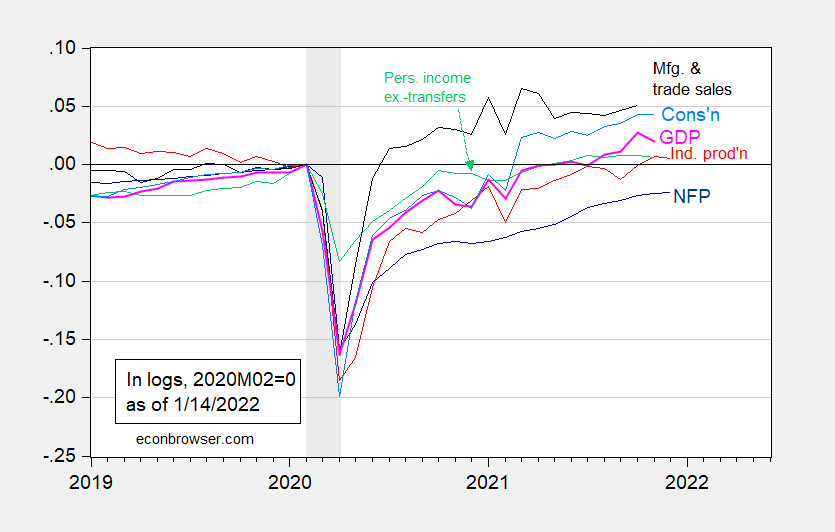
Figure 1: Nonfarm payroll employment (dark blue), industrial production (red), personal income excluding transfers in Ch.2012$ (green), manufacturing and trade sales in Ch.2012$ (black), consumption in Ch.2012$ (light blue), and monthly GDP in Ch.2012$ (pink), all log normalized to 2020M02=0. NBER defined recession dates, peak-to-trough, shaded gray. Source: BLS, Federal Reserve, BEA, via FRED, IHS Markit (nee Macroeconomic Advisers) (1/3/2022 release), NBER, and author’s calculations.
Manufacturing production also missed (-0.3% vs. +0.5% consensus).
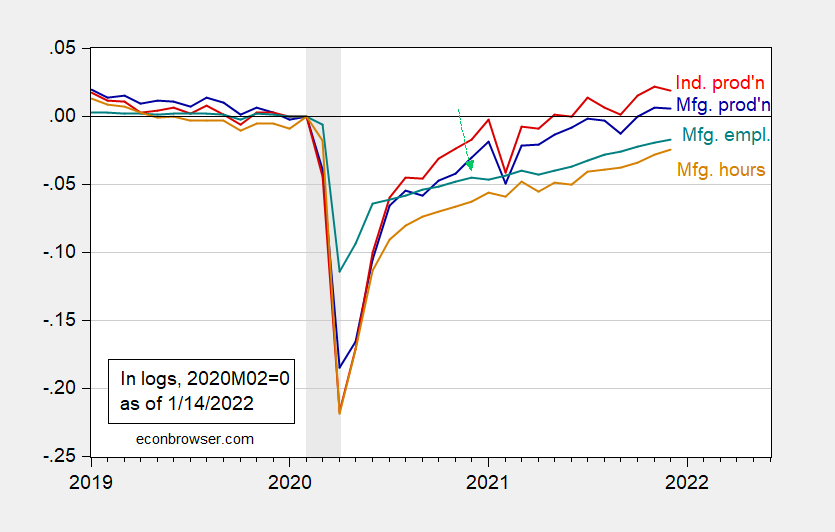
Figure 2: Industrial production (red), manufacturing production (blue), manufacturing employment (green), manufacturing aggregate hours for production & nonsupervisory workers (brown), all seasonally adjusted, all in logs 2020M02=0. NBER defined recession dates, peak-to-trough, shaded gray. Source: Federal Reserve Board via FRED, BLS, NBER, and author’s calculations.
The volatile utilities component of IP fell 1.5% m/m, partly offsetting the 2% increase in mining.
Regarding manufacturing, the business equipment category decreased by 0.5%, which is sensitive to capital investment expenditures, possibly signaling a deceleration (possible, because, we don’t knowif it’s supply or demand induced). Automotive parts production was down 1.3% m/m.
Finally, nominal retail sales (ex. food services) undershot as well, -2.3% vs. +0.2% consensus. In real terms:
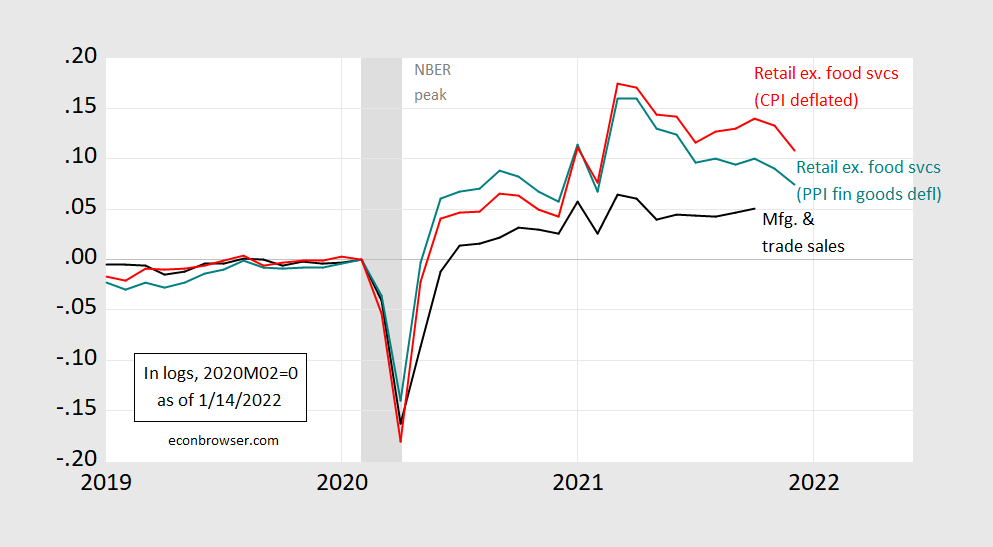
Figure 3: Manufacturing and Trade Industry Sales, 2012Ch.$ (black), retail sales ex-food services deflated by CPI (red), retail sales ex-food services deflated by PPI for finished goods (teal), all in logs 2020M02=0. NBER defined recession dates, peak-to-trough, shaded gray. Source: Federal Reserve Board via FRED, Census, BLS, NBER, and author’s calculations.
Jason Furman observes that the decline of real sales toward trend might be seen as a signal of normalization, as spending on goods reverts to pre-pandemic rates. In terms of business cycle indicators, to the extent that manufacturing and trade industry sales are correlated with retail sales, this hints at a downward movement in the black line in Figure 1. (Since July 2020, each 1 ppt change in PPI deflated retail sales is associated with 0.5 ppt change in real manufacturing and trade industry sales, with adj.R-squared of 0.75).
These are backward-looking indicators. High-frequency indicators based on weekly data (Baumeister et al. index, see this post, as well as this post) show continued growth through December.
(Click on image to enlarge)
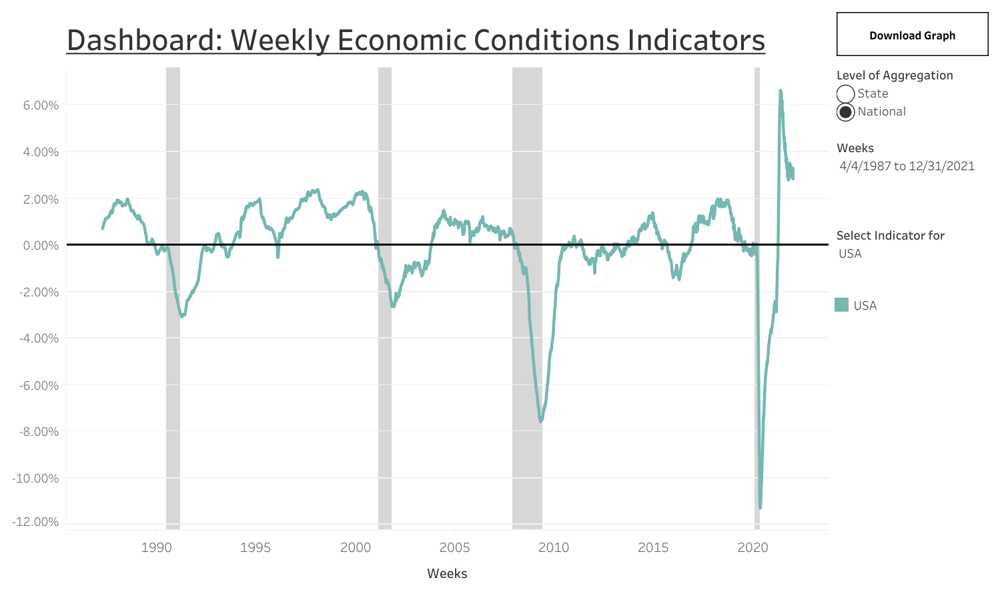
Source: Weekly Economic Conditions Index, accessed 1/14/2022.
A similar pattern is shown in the Lewis-Mertens-Stock indicator.
On the other hand, indicators for the high-contact services sector suggest a downturn there.
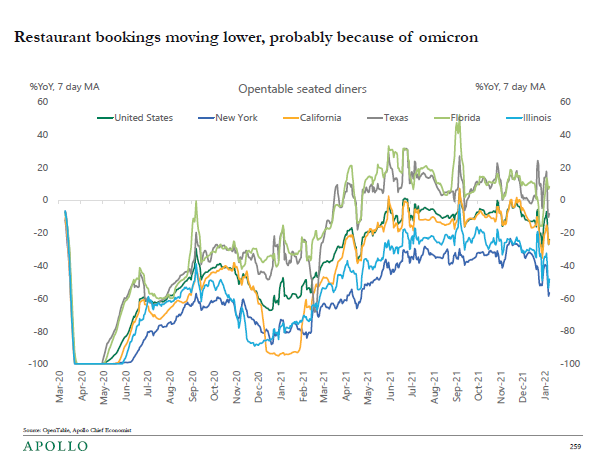
Source: Torsten Slok/Apollo, communication of 1/14/2022.
Disclosure: None.


