
Here are some key indicators followed by the NBER Business Cycle Dating Committee. I’ve added civilian employment to the set of indicators. Below are the trends over the recession and recovery to date, with some guesses for June consumption, May & June sales(since numbers are released on 7/29) and July employment (released on 8/5).
(Click on image to enlarge)
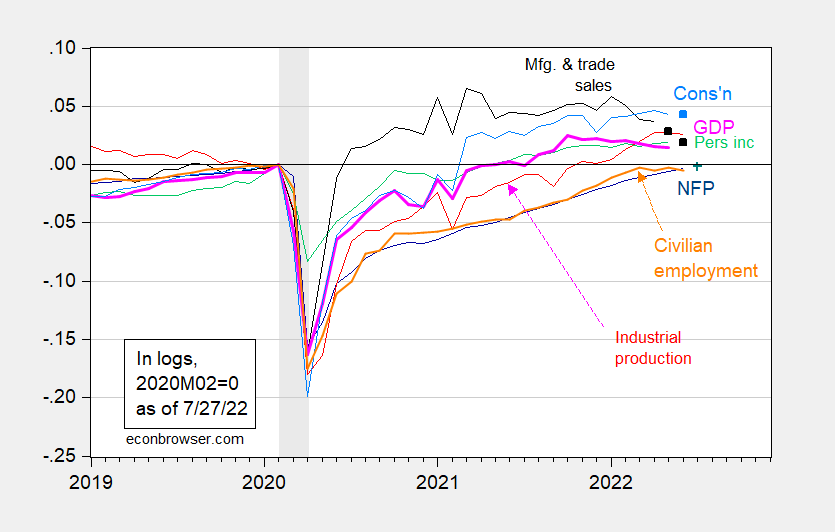
Figure 1: Nonfarm payroll employment (dark blue), Bloomberg consensus as of 7/27 (blue +) industrial production (red), personal income excluding transfers in Ch.2012$ (green), manufacturing and trade sales in Ch.2012$ (black), projected sales based on retail sales (black squares), consumption in Ch.2012$ (light blue), projected consumption based on retail and food sales (light blue squares), and monthly GDP in Ch.2012$ (pink), all log normalized to 2020M02=0. NBER defined recession dates, peak-to-trough, shaded gray. Source: BLS, Federal Reserve, BEA, via FRED, IHS Markit (nee Macroeconomic Advisers) (7/1/2022 release), NBER, and author’s calculations.
Since we have manufacturing and trade sales only through April, and consumption through May, I have forecasted these based on a log first differences regression 2021M04 onward. For consumption, the adjusted R2 is 72%, for sales, it’s 43%.
Manufacturing and trade sales continue their decline, as might be expected as consumption shifts away from goods toward services. Consumption essentially stabilizes, growing at 0.6% annualized. Bloomberg consensus for NFP indicates +255 K, so continued recovery in the labor market.
More By This Author:
Nowcasts and Forecasts of 2022Q2 GDP GrowthThe China Outlook from the WEO
IMF Downgrades Growth Outlook


Comments
Log in or sign up to join the conversation.