
NFP employment increase of 311K beat the Bloomberg consensus of 205K. This number confirms the continued strength in the economy overall, at least according to the key indicators followed by the NBER BCDC plus S&P Global (nee IHS Markit) monthly GDP.
(Click on image to enlarge)
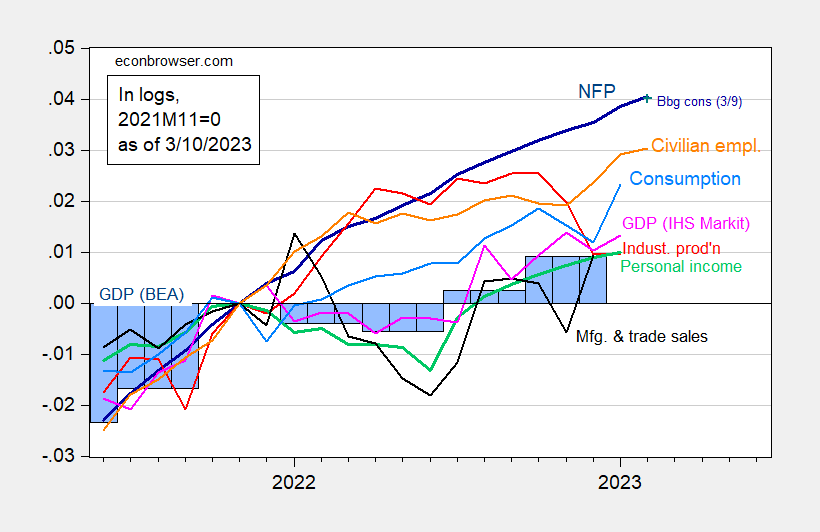
Figure 1: Nonfarm payroll employment, NFP (dark blue), Bloomberg consensus of 3/9 (blue +), civilian employment (orange), industrial production (red), personal income excluding transfers in Ch.2012$ (green), manufacturing and trade sales in Ch.2012$ (black), consumption in Ch.2012$ (light blue), and monthly GDP in Ch.2012$ (pink), GDP (blue bars), all log normalized to 2021M11=0. Q3 Source: BLS, Federal Reserve, BEA 2022Q4 2nd release via FRED, S&P Global/IHS Markit (nee Macroeconomic Advisers) (3/1/2023 release), and author’s calculations.
Given the debate over the strength of the labor market, particularly insofar as it relates to the 2022H1 figures, the following graph highlights the fact that if there was a slowdown in 2022H1 (particularly 2022Q2), it’s largely been reversed.
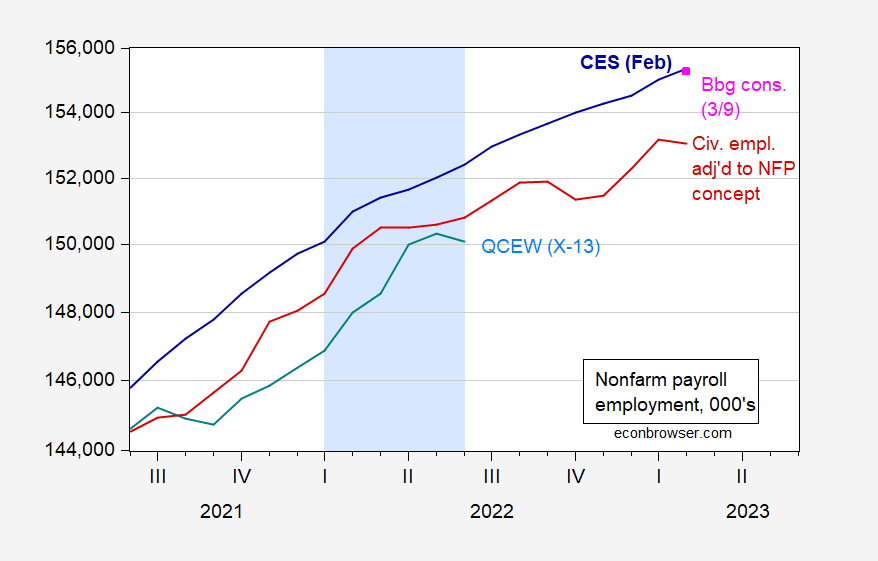
Figure 2: Nonfarm payroll employment from February 2023 CES release (blue), Bloomberg consensus as of 3/9 (red square), household series adjusted to NFP concept (red), QCEW total covered workers, seasonally adjusted using log transformed Census X-13 (teal), all in 000’s, s.a. Light blue shading denotes a hypothesized 2022H1 recession. Source: BLS, BLS QCEW, and author’s calculations.
While the employment increase was larger than expected, this was on downwardly revised December and January numbers summing to 55K; in other words, in terms of the level of employment, the 311K translates to 206K increase compared to 205K consensus increase.
Here’s another picture of the evolution of the labor market, from various perspectives — total NFP, aggregate hours from private NFP, civilian employment, and private NFP from ADP.
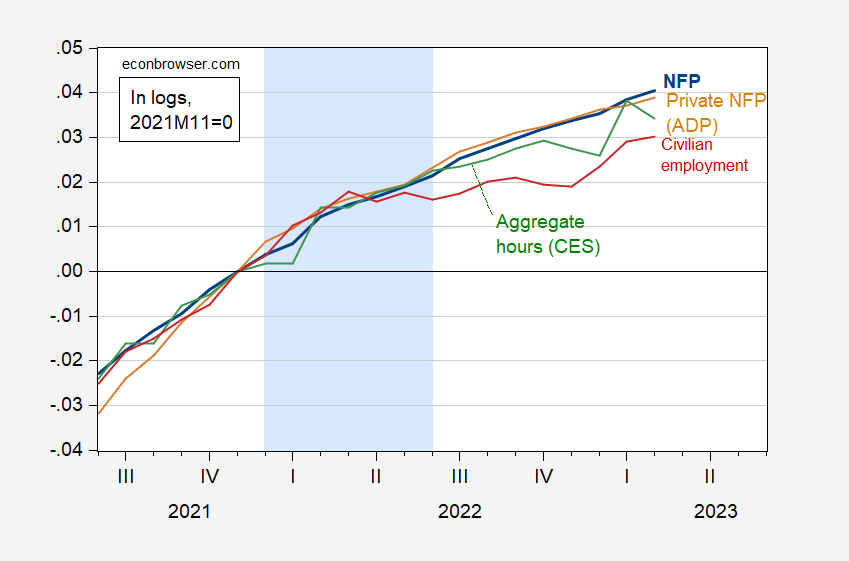
Figure 3: Nonfarm payroll employment from February 2023 CES release (blue), aggregate hours (green), Private NFP series from ADP (tan), civilian employment (red), all s.a., in logs 2021M11=0. Light blue shading denotes a hypothesized 2022H1 recession. Source: BLS and ADP via FRED, and author’s calculations.
More By This Author:
The Administration’s GDP Forecastr vs. g
Econ 702 Exercise – The Neoclassical Model: GDP And Shocks


Comments
Log in or sign up to join the conversation.