

Image Source: Pexels
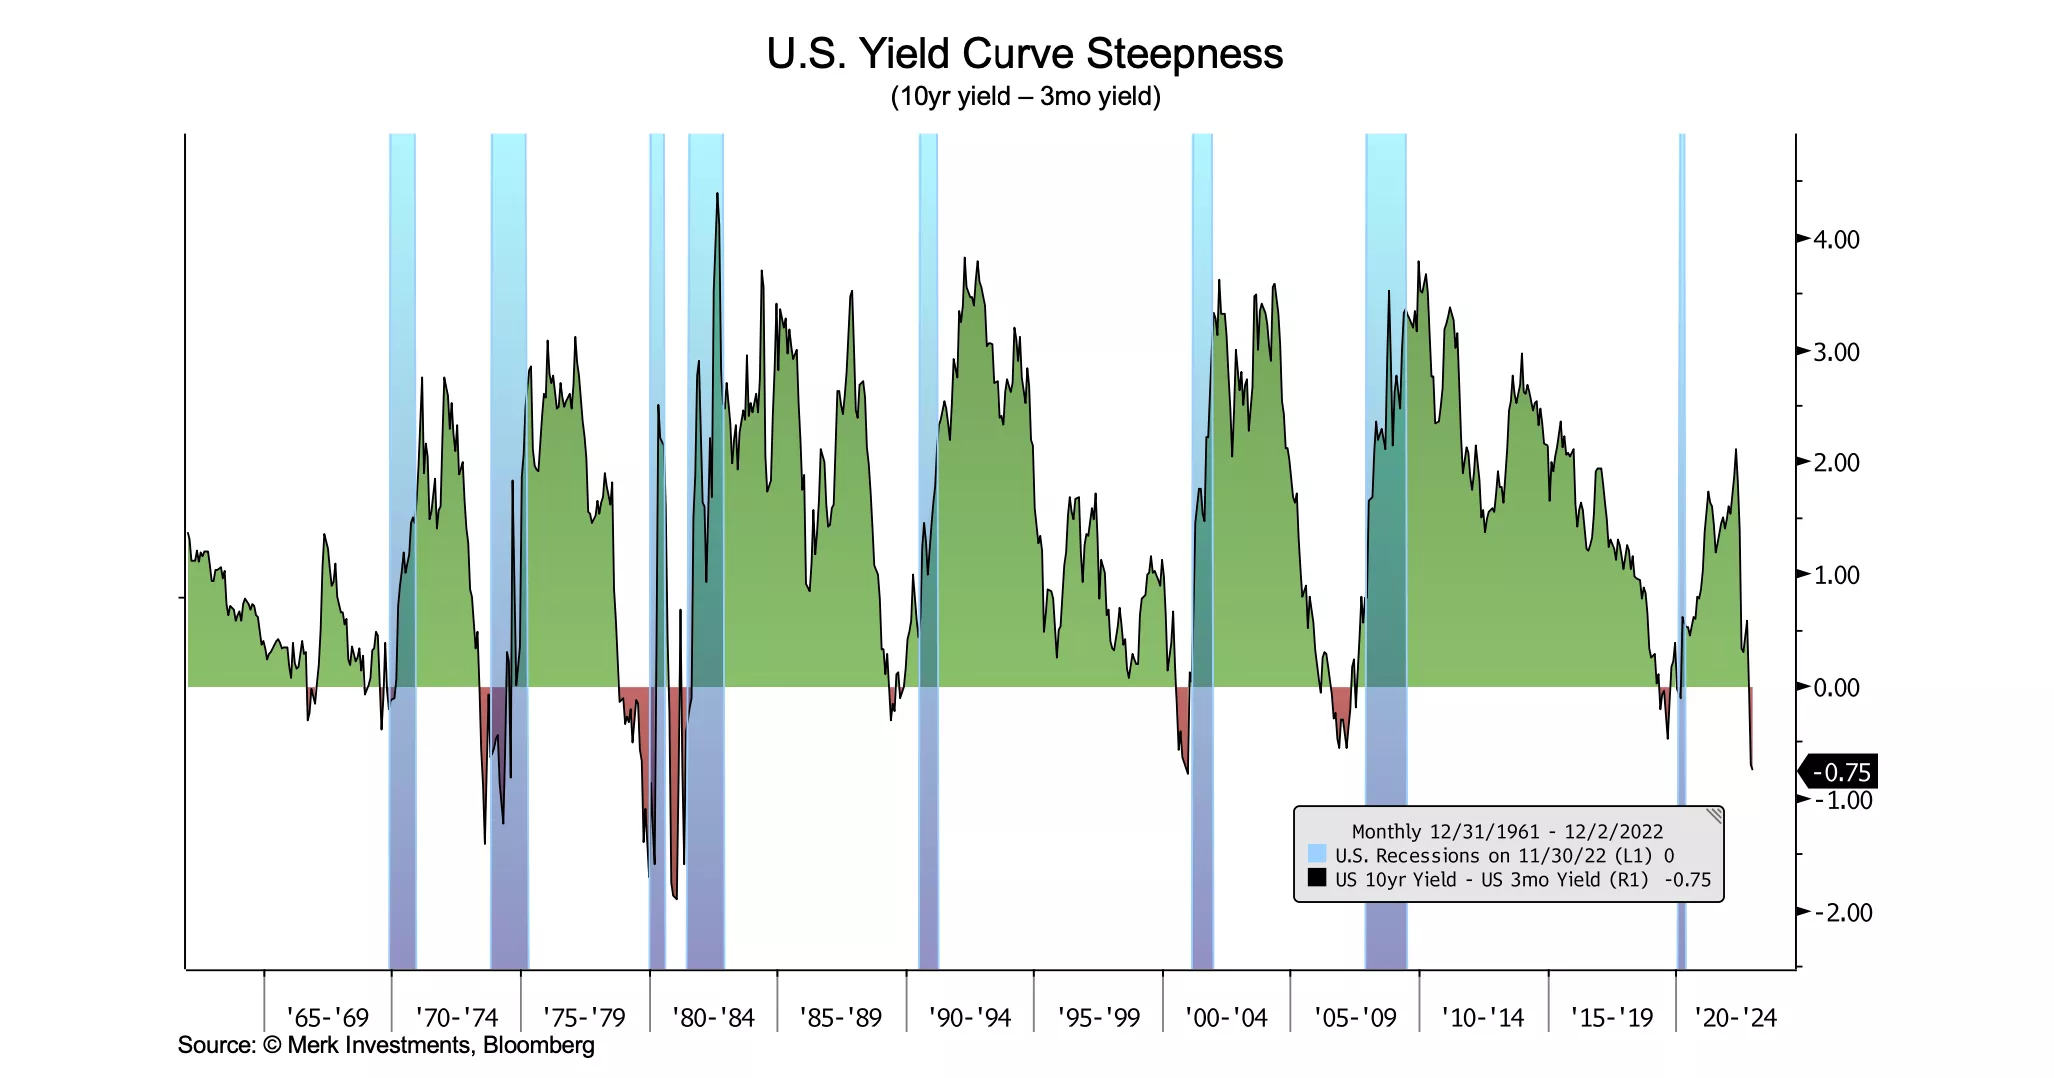
Incoming data continues to be consistent with a high recession risk for 2023. The US Manufacturing PMI has fallen below 50 (the dividing line between expansion and contraction) for the first time since March 2020. Also, all relevant yield curves are now deeply inverted. The 10y3m yield curve went from -1bp inverted at the end of October to -75bps inverted at the end of last week. Notably, the Fed’s preferred yield curve measure, the implied 3-month yield in 18 months minus the current 3-month yield, is now inverted and close to the max depth of recent decades. A bull steepening in 2s10s is the next development to watch for, i.e., yield curve steepening with 2yr yields falling faster than 10yr yields.
Last week’s jobs report was mixed but on balance weak. The solid non-farm payrolls number from the establishment survey was not confirmed by a positive number from the household survey. And the unemployment rate was unchanged along with another decline in the labor force participation rate. The headline unemployment rate is now above its 12-month moving average, historically a precondition to recessions (particularly with a falling participation rate). Supporting that trend is the San Francisco Fed’s leading unemployment rate model, which has been moving steadily higher since May. Additionally, with data revisions, it now looks like temporary jobs peaked back in July. That’s typically a long leading indicator and one that we can now add to the checklist of recession warning signs.
The New York Fed’s latest Household Debt and Credit Report for Q3 showed a continued increase in transitions into delinquency and suggests that the household credit cycle is turning.
Even the Fed’s own recession probability models are well above the warning level. The data suggests that a recession is highly likely over the next year and yet a recession doesn’t seem to be fully priced into markets as judged by credit spreads or S&P 500 dividend futures, let alone sell-side earnings estimates (which may not reflect what’s actually priced into markets).
In summary, the weight of the evidence currently suggests that recession risk is very high, with negative implications for the stock market relative to current levels. As always, the outlook remains data dependent and requires constant reassessment.
More By This Author:
Equity Market Chart Book
Business Cycle Chart Book - Thursday, Nov. 10
Equity Market Chart Book - Wednesday, Oct. 26


Comments
Log in or sign up to join the conversation.