
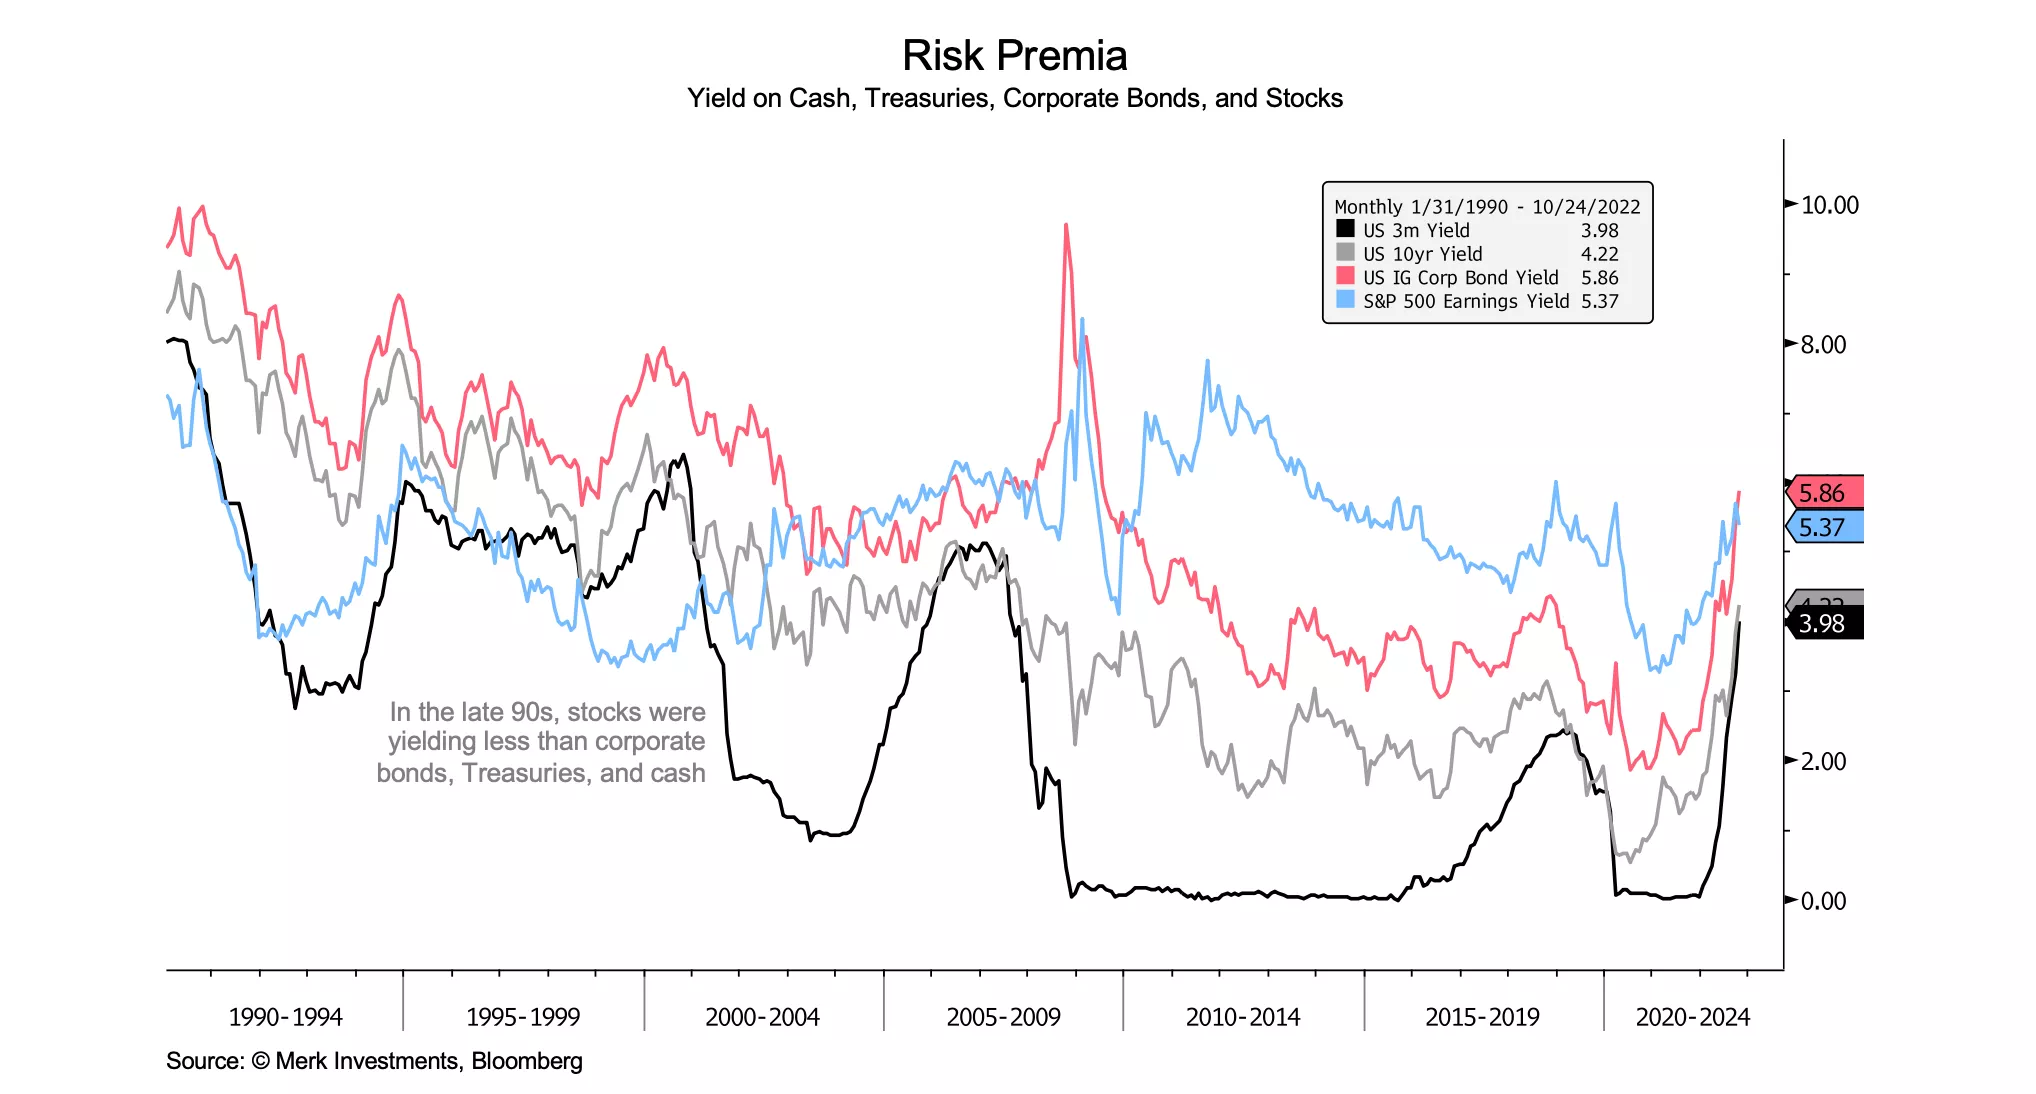
High and rising interest rates should continue to pressure valuation multiples in the equity market. The investment-grade corporate bond yield is higher than the S&P 500 earnings yield for the first time in over a decade (5.8% vs 5.4%). And the US 10-year Treasury yield is more than double the S&P 500 dividend yield (4.2% vs. 1.7%). The TINA effect (“there is no alternative” to stocks) that underpinned rising valuations in the 2010s continues to reverse.
While the market may have a short-term rally, pressure on valuations from higher rates, an earnings slowdown, and a potential recession are all likely to weigh on the equity market medium term. In other words, there’s downside risk to both the price-to-earnings ratio itself and to the denominator (earnings).
The max drawdown in the S&P 500 so far has been 25% over a 9-month period. The current bear market hasn’t quite reached historical central tendencies in terms of depth or duration, but it’s getting close. To review the history of S&P bear markets, the mean bear market duration is 17 months (with a massive range: 1-42 months), the median is 13 months, and the central tendency is 8-21 months. The mean decline is 39% (also with an extensive range), the median is 34%, and the central tendency is 27-49%. Also, markets tend to bottom in a recession rather than before a recession, with the market typically down in the first half of a recession and up in the second half.
The current macroeconomic and market environment likely still favors defensive sector tilts (+energy) and value factor tilts. As noted recently, ultra-short duration TIPS may provide attractive absolute returns and diversification benefits to traditional stocks and bonds, particularly against the risk of inflation remaining elevated longer than what’s currently priced into the market. Short-term real rates (currently near +2%) are in the top decile of their historical range, above longer-term real rates, and well above most estimates of the neutral real rate (r*).
The US dollar appears to be approaching a major turning point. Real interest rate differentials and terms of the trade no longer favor the dollar. Dollar strength at this stage is likely primarily driven by the ongoing global growth slowdown and associated global dollar short squeeze, perhaps to peak around the time that high yield credit spreads peak and/or around the time that Fed swap line uptake becomes meaningful (e.g., >$50B). A secularly weakening dollar should support international stock markets (and emerging markets in particular) relative to the domestic market. For now, the path of least resistance for the dollar is likely still higher in the short term.
In summary, the balance of risks to the market remains skewed to the downside but there are a number of plausible paths the market could take from here and uncertainty remains elevated. As always, the outlook remains data-dependent and everyone needs to put probability and reward-to-risk assessments in the context of their strategy, process, and time horizon.
More By This Author:
Business Cycle Chart Book
TIPS - A Misunderstood Inflation Hedge
Equity Market Chart Book - Wednesday, Sept. 21


Comments
Log in or sign up to join the conversation.