Bull Markets
With the S&P 500 notching another all-time high today, it means the bull market that began on October 12th, 2022 has once again been confirmed. Check out our well-known table below that shows historical bull and bear markets for the S&P.
What's significant here? For starters, it may be hard to believe, but the current bull has gone on for basically as long as the post-COVID bull market that ran from March 2020 to January 2022. The current bull is now at 637 calendar days in length compared to the post-COVID bull that ended up lasting 651 days.
While the current bull and the post-COVID bull are now similar in length, this bull has only seen a gain of 57.5% compared to a gain of 114.4% for the post-COVID bull.
At 57.5%, the current bull is still about 20 percentage points below the median bull market gain of 76.7%, and it's about half the average bull market gain of 114.4%.

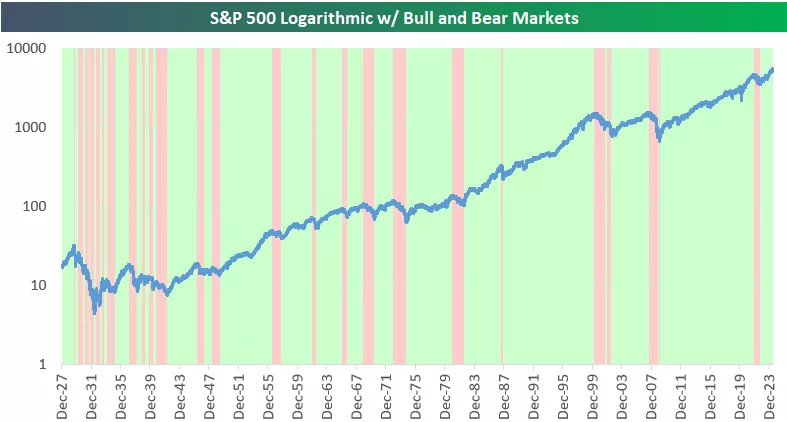
Below is a log chart of the S&P 500 since its inception in 1928 with bull markets shaded in green and bear markets shaded in red. The shading does a good job of highlighting how much longer bull markets typically last than bear markets.

More By This Author:
Small Business Capex Tumble
Airline Stocks In A Holding Pattern
The Best Of Times, The Worst Of Times
Disclaimer: Bespoke Investment Group, LLC believes all information contained in this report to be accurate, but we do not guarantee its accuracy. None of the information in this report or any ...
more


