British Pound/ U.S. Dollar Forex Elliott Wave Technical Analysis

Photo by Colin Watts on Unsplash
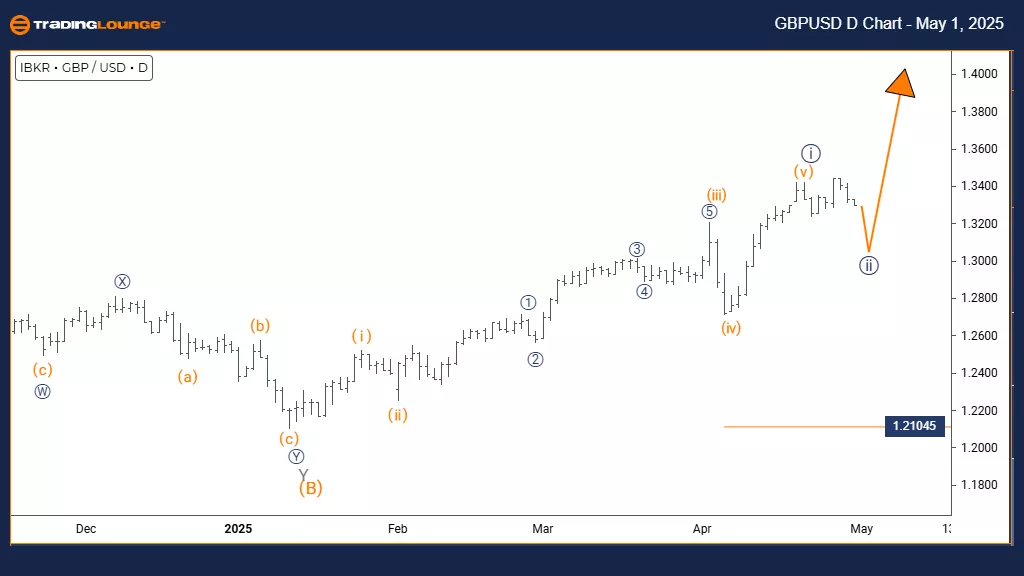
British Pound/ U.S. Dollar (GBPUSD) Day Chart
GBPUSD Elliott Wave Technical Analysis
Function: Counter Trend
Mode: Corrective
Structure: Navy Blue Wave 2
Position: Gray Wave 1
Direction Next Higher Degrees: Navy Blue Wave 3
Details: Navy Blue Wave 1 seems completed, and now Navy Blue Wave 2 is active.
Cancel Invalid Level: 1.21045
The daily analysis of GBPUSD shows a counter-trend correction unfolding inside a larger bearish movement. The pair has finished the navy blue wave 1 decline and has now started the navy blue wave 2 correction, continuing within the broader gray wave 1 downtrend. This setup suggests a short-term upward retracement before the primary bearish trend possibly resumes.
The navy blue wave 2 indicates a correction phase that usually retraces between 38% and 61% of wave 1's drop. This often forms standard corrective patterns like zigzags or flats. After the strong downward movement of wave 1, the conditions are now set for this pullback, typically featuring overlapping prices and weaker momentum. The daily timeframe points to an intermediate-term pause in the overall bearish sequence.
Next Movement Expectations
The forecast shows a downward navy blue wave 3 after wave 2 finishes. This third wave should become the strongest and longest part of the pattern, possibly falling well below wave 1's bottom. A key level to monitor is 1.21045; a daily close above it would invalidate the current bearish wave count and require reassessment.
Market participants should track wave 2's evolution and watch for usual reversal signals, such as bearish candlestick patterns, overbought readings on momentum indicators, and volume patterns indicating distribution. The current correction provides a tactical opportunity for preparing for the wave 3 decline. Using technical analysis tools will help confirm the end of the correction and the start of the next downward move.
This correction is seen as a normal consolidation within the broader bearish trend, offering traders a setup to enter positions ahead of the potential drop. Observing price action around key Fibonacci retracement levels will be crucial for timing entries effectively as the transition from wave 2 to wave 3 unfolds. The daily analysis highlights the importance of this corrective phase in the larger bearish scenario.
(Click on image to enlarge)

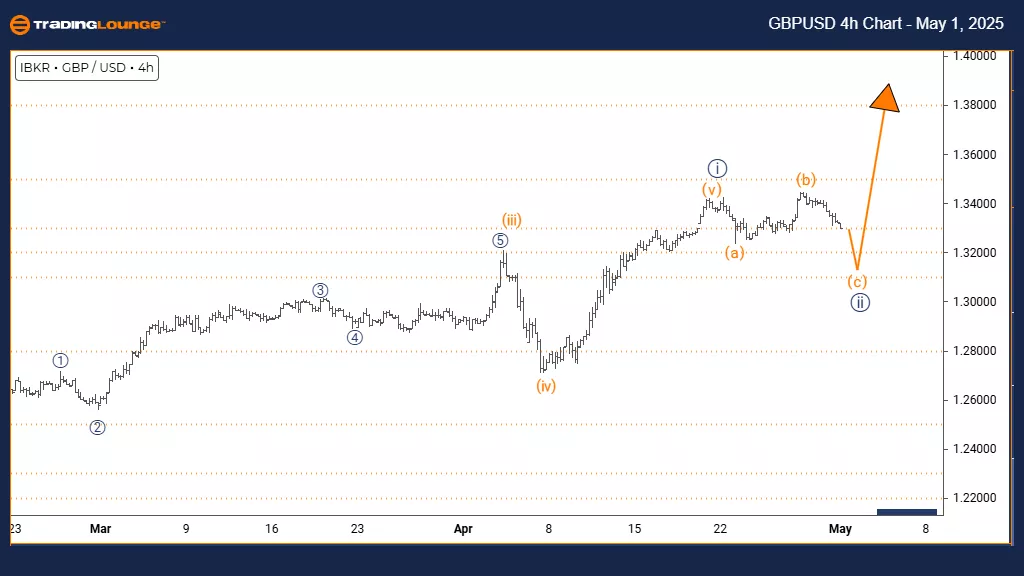
British Pound/ U.S. Dollar (GBPUSD) 4 Hour Chart
GBPUSD Elliott Wave Technical Analysis
Function: Counter Trend
Mode: Corrective
Structure: Navy Blue Wave 2
Position: Gray Wave 1
Direction Next Higher Degrees: Navy Blue Wave 3
Details: Navy Blue Wave 1 seems completed, and now Navy Blue Wave 2 is active.
Cancel Invalid Level: 1.21045
The GBPUSD 4-hour chart review highlights a counter-trend correction forming within a larger bearish setup. The pair has finished the navy blue wave 1 drop and has entered into the navy blue wave 2 correction inside the broader gray wave 1 downtrend. This structure suggests a short-term upward retracement is in motion before the potential continuation of the main bearish trend.
The navy blue wave 2 phase typically retraces 38% to 61% of the wave 1 decline. The completion of the downward wave 1 has prepared the ground for this pullback, usually characterized by overlapping prices and weaker momentum. The 4-hour timeframe indicates this movement might be a short pause in the broader bearish framework.
Next Movement Expectations
The next expected move is a downward navy blue wave 3 after the end of the wave 2 correction. This wave is projected to be the strongest part of the sequence, likely moving significantly beyond wave 1's low. The key level to monitor remains 1.21045; a break above it would invalidate the current wave structure and require an updated analysis.
Traders should watch wave 2’s progress for typical termination signals like bearish reversal patterns and momentum indicators showing overbought levels. This ongoing correction offers potential entry points for the forecasted wave 3 decline. Using technical analysis tools will aid in confirming the end of wave 2 and the start of the downward impulse.
This corrective period acts as a standard interruption in the greater downtrend, giving traders an opportunity to position themselves ahead of the next major move down. Monitoring price action around critical Fibonacci retracement levels will be important for optimizing entry timing as the market shifts from wave 2 to wave 3.
(Click on image to enlarge)

More By This Author:
Unlocking ASX Trading Success: Car Group Limited - Wednesday, April 30
Elliott Wave Technical Analysis: MicroStrategy Inc. - Wednesday, April 30
Elliott Wave Technical Analysis: U.S. Dollar/Japanese Yen - Wednesday, April 30
At TradingLounge™, we provide actionable Elliott Wave analysis across over 200 markets. Access live chat rooms, advanced AI & algorithmic charting tools, and curated trade ...
more


