
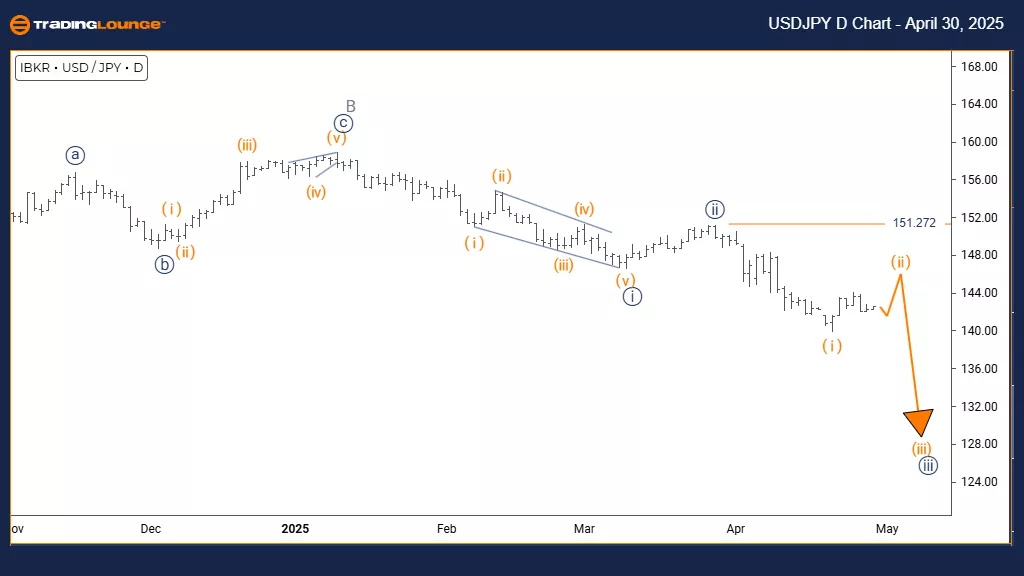
U.S. Dollar / Japanese Yen (USDJPY) – Day Chart
USDJPY Elliott Wave Technical Analysis
FUNCTION: Counter Trend
MODE: Corrective
STRUCTURE: Orange Wave 2
POSITION: Navy Blue Wave 3
DIRECTION NEXT LOWER DEGREES: Orange Wave 3
DETAILS: Completion of orange wave 1 appears done. Now, orange wave 2 is active.
Wave Cancel/Invalid Level: 151.272
The daily chart for USDJPY shows a counter-trend correction occurring within a larger upward structure. Orange wave 1 appears to have ended, leading to the initiation of orange wave 2 within the ongoing navy blue wave 3 uptrend. This indicates a short-term pullback, likely temporary, before the bullish momentum resumes.
Orange wave 2 represents a classic corrective pattern, typically retracing between 38% to 61% of wave 1. These corrections often take the shape of zigzags or flats. With wave 1 forming a strong upward movement, the ongoing pullback displays overlapping price movements and slower momentum—common traits of corrective waves. This phase reflects a temporary pause in the longer-term upward trajectory.
The next expected move is the start of orange wave 3, projected to follow the end of wave 2. This wave may turn out to be the strongest and most extended phase, potentially exceeding the high of wave 1. Traders should closely monitor 151.272 as the invalidation level—if the price closes below this, the current bullish count should be reanalyzed.
Traders need to observe traditional wave 2 termination signals such as bullish candlestick reversals, momentum turning from oversold, and volume suggesting accumulation. This correction phase provides strategic opportunities to position for the upcoming wave 3 rally. Utilizing technical indicators will help determine when the correction is likely to end and the upward impulse begins again.
This pullback phase is considered a healthy consolidation within the dominant uptrend. It presents a favorable chance to prepare for a bullish continuation. Key Fibonacci retracement levels should be observed closely to identify optimal entry zones as the market transitions from wave 2 to wave 3. From the daily chart perspective, this correction is a notable part of the overall bullish scenario.
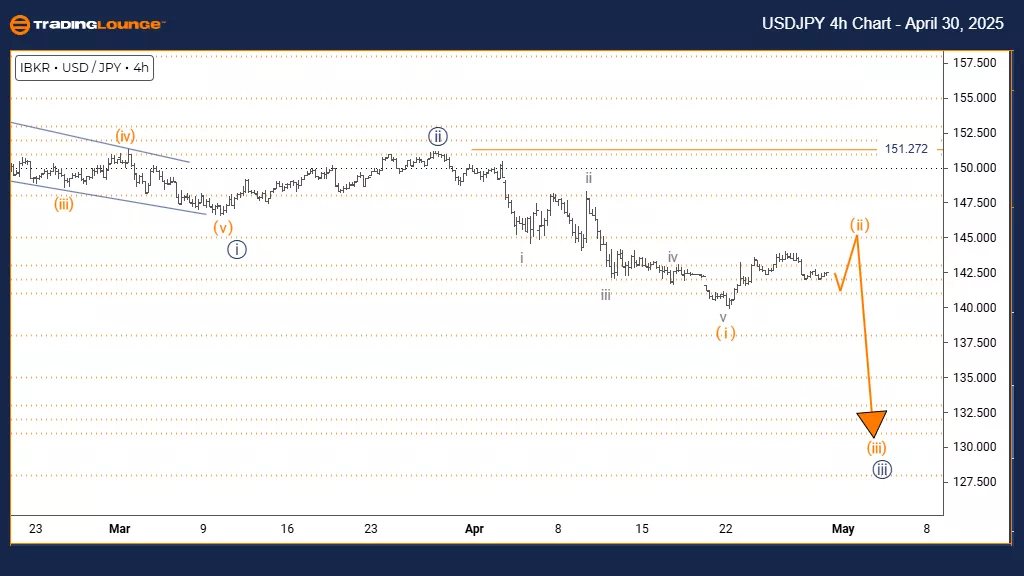
U.S. Dollar / Japanese Yen (USDJPY) – 4 Hour Chart
USDJPY Elliott Wave Technical Analysis
FUNCTION: Counter Trend
MODE: Corrective
STRUCTURE: Orange Wave 2
POSITION: Navy Blue Wave 3
DIRECTION NEXT LOWER DEGREES: Orange Wave 3
DETAILS: Orange wave 1 seems completed; orange wave 2 is underway.
Wave Cancel/Invalid Level: 151.272
The 4-hour USDJPY chart reveals a counter-trend correction unfolding within a broader bullish framework. Orange wave 1 has likely ended, initiating orange wave 2 within the larger navy blue wave 3 uptrend. This implies a short-term retracement before the primary upward movement potentially resumes.
Wave 2 is expected to retrace part of wave 1’s move, often supported around the 38% to 61% Fibonacci levels. This correction phase typically exhibits overlapping price action and reduced momentum, both common in corrective structures. The 4-hour timeframe identifies this as a short-term consolidation within the prevailing bullish structure.
Following the completion of wave 2, the next projected movement is orange wave 3 upward. This impulse is likely to be the strongest part of the pattern, potentially surpassing the peak of wave 1. The 151.272 level remains key—if price closes below it, the current wave structure may no longer be valid.
Traders should track signs of wave 2 ending, including bullish reversal candles and indicators pointing to oversold conditions. The ongoing correction could offer entry opportunities ahead of the expected wave 3 rise. Using technical tools will help confirm when the new impulse is ready to begin.
This pullback should be viewed as a typical consolidation within a rising trend, giving traders time to assess positions. Watching Fibonacci retracement areas closely will support well-timed entries as the chart shifts from wave 2 to wave 3.
Technical Analyst: Malik Awais
Visit TradingLounge.com and learn from the experts!
More By This Author:
Elliott Wave Technical Analysis: Theta Crypto Price News For Wednesday, April 30
Unlocking ASX Trading Success - Insurance Australia Group
Elliott Wave Technical Analysis Costco Wholesale Corp.


Comments
Log in or sign up to join the conversation.