Breadth Lagging New Highs
Below is a chart of the S&P 500-tracking SPY ETF from our Interactive Chart Tool platform (use it for free at any time here). If current prices hold, the S&P will make a new all-time closing high today…eclipsing highs last made in early August.
(Click on image to enlarge)

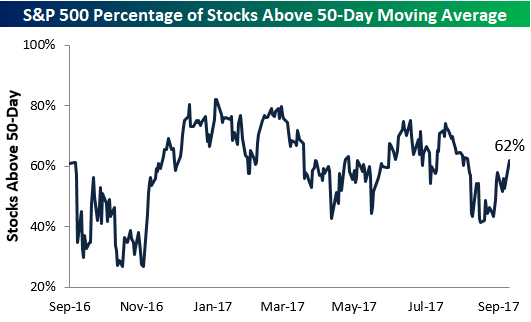
We’ve been covering underlying market breadth quite a bit over the last few weeks, and as shown below, as of this afternoon, 62% of stocks in the S&P 500 are above their 50-day moving averages. We realize the S&P 500 just made a new high today, but 62% is well below prior high points seen for this breadth measure over the last year. We’d like to see it more elevated when a new high for the index is made.
(Click on image to enlarge)

Disclaimer: To begin receiving both our technical and fundamental analysis of the natural gas market on a daily basis, and view our various models breaking down weather by natural gas demand ...
more


