
Breadth, Headlines, Trade, Earnings... All Improving?
You're going to see a heck of a lot of charts thrown about social media and market technicians (CMTs), but make no mistake about it folks, the weekly expected move capped the upside and prevented the market from achieving a new all-time high last week.
All Things S&P 500
With 2 smaller weekly gains in a row, market breadth had been improving, slowly but steadily. There's been no such over exuberance in the market to speak of in the way of investor sentiment, money flows or even market volume. Our first chart out of the gate this week is a review of more favorable breadth momentum for the S&P 500. It depicts the declining number of S&P 500 stocks 20% below their highs.
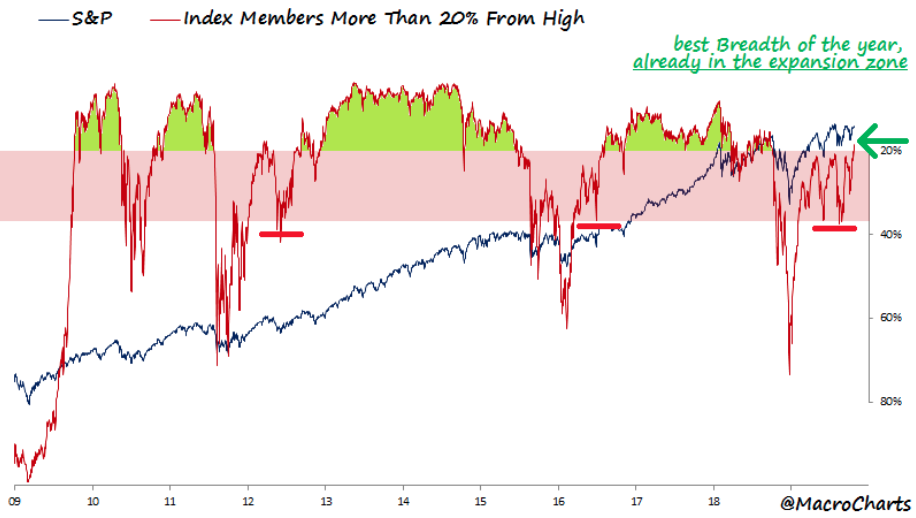
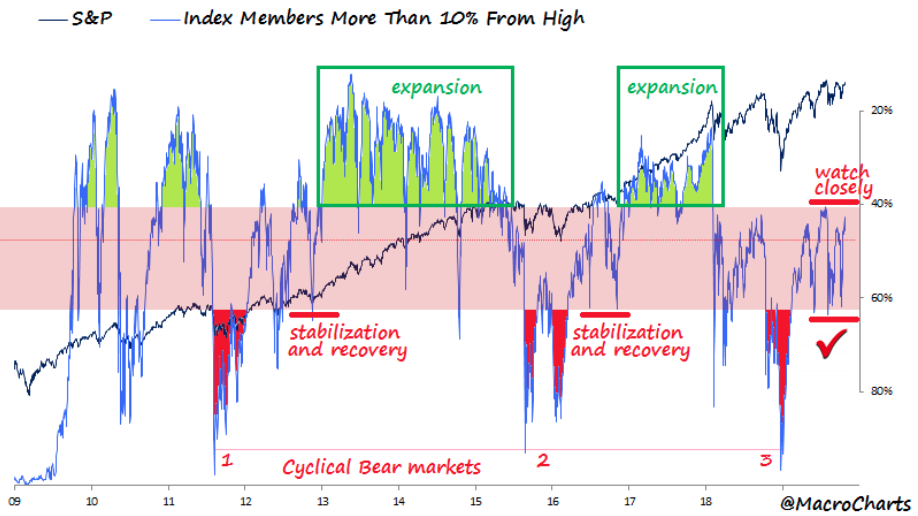
As we can see from the chart, the red line has been moving higher, indicating fewer stocks are more than 20% below their highs. This is improving breadth folks. Our second chart from the MacroChart-ist is even more favorable because it tightens the breadth criterion. The second chart depicts the S&P 500 stocks down more than 10% from their highs and identifies coiling similar to 2012 and 2016 when those expansion rallies began.
Many breadth indicators have improved over the last 3 weeks and are presenting the case for upside breakout near-term. The near-term indication is highly subjective and as such, we'll put our definition and outlook to it as follows: As I noted in the previous week, the percentage of stocks trading above their 200-DMA had improved for 2 consecutive weeks. We can now make that 3 consecutive weeks after the S&P 500 rallied 1.22% in the past trading week. In last week's Research Report, the number of stocks trading above their 200-DMA was roughly 63.7 percent.
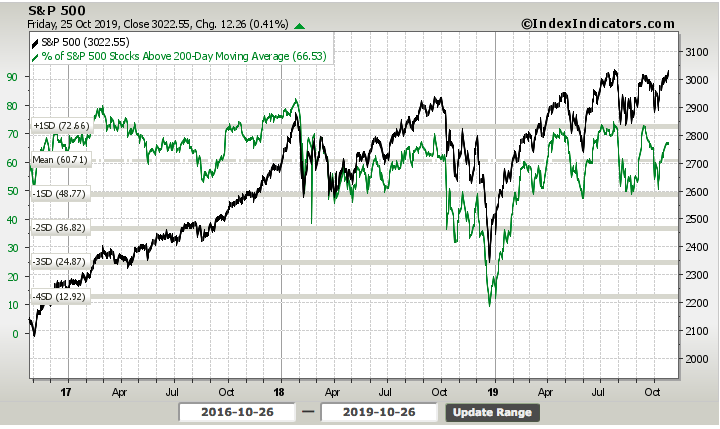
Breadth has improved to show 66.5% of S&P 500 stocks are trading above their 200-DMA. But let's not stop there; let's take a look at how many stocks are trading above their 50-DMA presently.
In looking at both the charts depicted above we are to determine 2 takeaways:
- Based on former breadth moves, there is still some room to run in the S&P 500.
- More relative strength must correspond for the S&P 500 to maintain above 3,000 and achieve new all-time highs.
While market breadth remains on a positive path higher, one of our more positive charts that aligns with our near-term and longer-term outlook continues to be the moving averages.
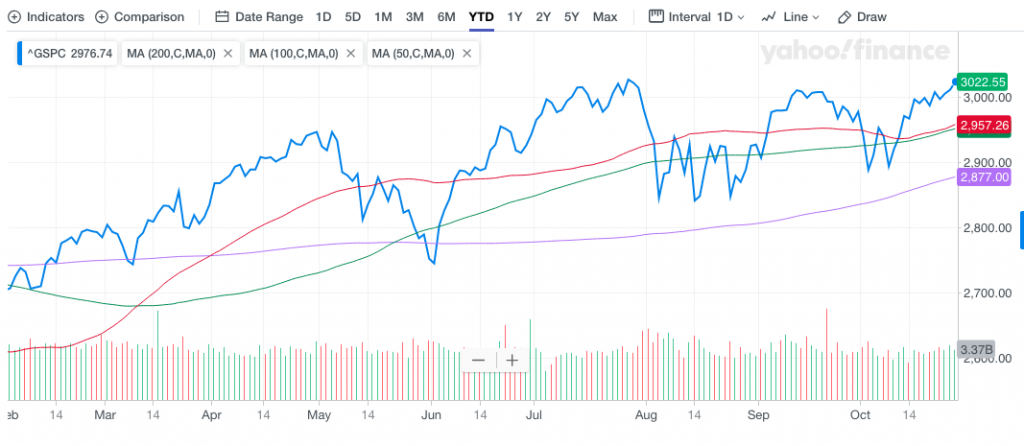
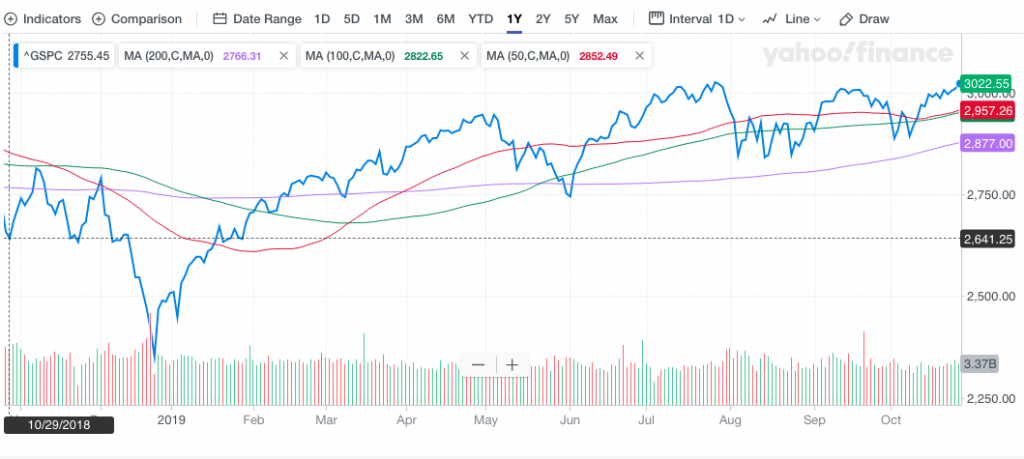
Why do I say this is one of our most positive charts for both time frames specified? Very simply, when I look at the right-hand part of the chart, we can see the moving averages are all curling upward. That's what I desire to see most and what points to a dramatic difference from October of 2018. If we expand the chart to show the same time period from last October 26th, we can see the 50-DMA completely rolling down and the S&P 500 itself trading below all 3 moving averages. This is the look, we are always desiring to avoid.
With the DMAs outlined and the S&P 500 trading above all 3 presently, we can also look at exponential moving averages to define strength or weakness in breadth. SPOILER ALERT...IT'S ALL GOOD!
A quick look at the percentage of stocks trading above their 50 and 200-EMAs shows breadth does continue to improve. Having said that...
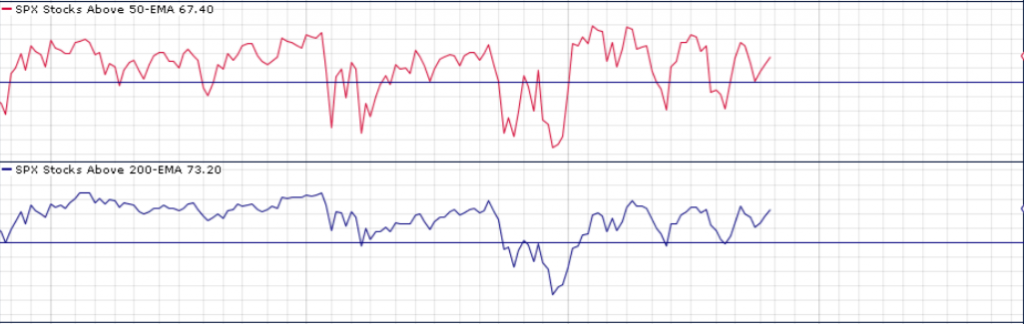
It would appear that the number of stocks trading above their 200-EMA are on the verge of topping, based on this year's peaks shown in the bottom chart. According to the top chart (number of stocks trading above their 50-EMA), we seem to have some room to run higher in the S&P 500. Thus far, based on all the breadth indicators we have researched, only one shows signs of topping.
Naturally, when we look at breadth we also want to look at the NYSE A/D line. But this time, let's see what it looks like on a longer-term horizon and compare it with the Dow Jones Industrial Average (DJIA, chart study from Tom McClellan)
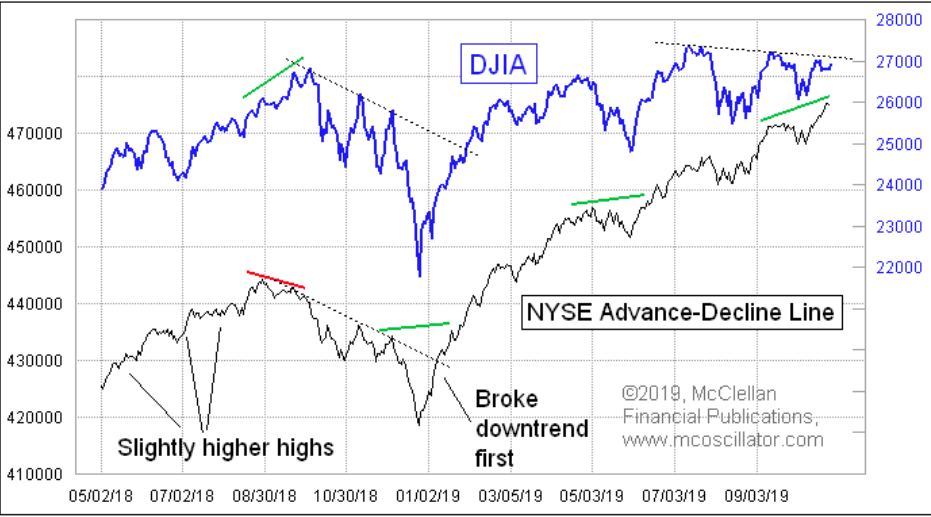
Compared to the new highs for the NYSE A/D line set in 2018, the look is presently much better. Additionally, for the S&P 500, we see that the new highs vs. new lows is continuing to improve. So much breadth, so little time!
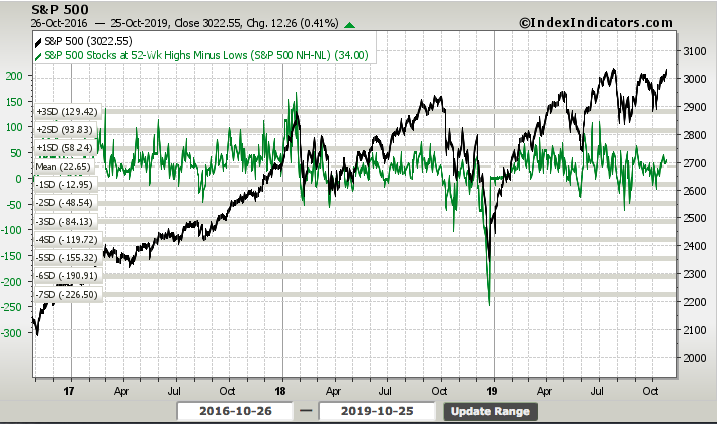
The number of stocks hitting 52-week highs versus the number of stocks hitting 52-week lows improved in the past trading week from 29 to 34. And again, like many of our other market internals and breadth indicators, this shows the S&P 500 has room to run higher.
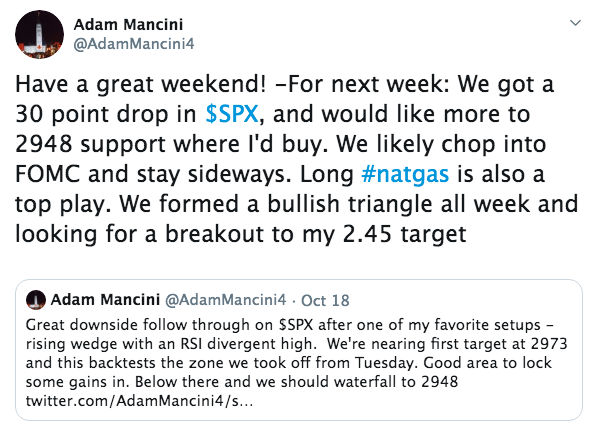
With all of these chart studies completed, we now remind readers of the call for the trading week just completed, by Adam Mancini. Recall from last week's Research Report that Adam Mancini was calling for a 30-point drop in the S&P 500 this past trading week.
"According to Adam Mancini, a fan-favorite on #Fintwit, a 30-point S&P 500 drop is in the cards this coming week."
This predictive move didn't come to fruition, but maybe another CNBC contributor and #fintwit fan-favorite's prediction will. Market Newton of Newton Advisors is expecting for the S&P 500 to reverse course "next week". We highlight the quotes because he barbells the occurrence happening either at the beginning of the week or at the end of the week.

In Newton's latest notes, he discusses his outlook for the coming trading week as follows:
"I am expecting a reversal of trend for the S&P 500 Index, which might start Friday, or early next week. Market breadth should be peaking today. The uptrend has not followed through as robustly as I thought possible last week.
Market breadth is starting to wane, and could start to turn down in the next few days. Stock indices like SPX have largely stalled out near former highs. While a push to minor new highs was thought possible into late October, the risk/reward is poor for new longs here, and Defensive positioning continue to be recommended. Upside resistance lies near 3014 and then 3027-45, while downside support is found at 2975-82 and thought to be important.
Overall, most of the cycles related to late April and July are all pointed to late October for some kind of turn and given the rally in October, it’s thought to be a peak. Defensive sectors have outperformed, not just for the last week, but the 1, 3 and 6 month basis, despite some Technology strength to hold up stocks in the last month, largely out of the large-cap Value space like Apple, while Semis have also held up, albeit in a shaky fashion. The fact that Equal-weighted Tech has turned down sharply to new monthly lows relative to the SPX is a minor concern here, as its thought that the broader space should be vulnerable in the weeks ahead. For now, while most S&P targets are up near 3027-45, the price action in the last week has been more consolidation than any real rally, just as this key time zone for trend change is approaching. Can markets get there? Potentially. But the risk/reward is turning sub-optimal to initiate new trading longs within most sectors, particularly Tech."
Newton's analysis and takeaways make a lot of sense and based on what we've already discussed in terms of breadth, this coming trading week could find the S&P 500 with another new all-time high and a reversal thereafter. This would especially be the case if Apple's (AAPL) shareholders decide to take profits on Wednesday, after the Q4 ER, and for whatever the reason might be. Wednesday is a very critical day for the market and jam-packed with mega-cap earnings results from the likes of Apple, Facebook (FB) and Starbucks (SBUX). Couple these earnings reports with the FOMC rate announcement, press conference, ADP payroll report and the first look at Q3 GDP and it has all the makings for an extremely important day. Such a day as this coming Wednesday is one that will either find the S&P 500 rally sustained through Newton's 3,045-level or retracing back below 3,000 in rather short order. Even with Adam Mancini's former call proving inaccurate, his latest outlook is offered with a little more upside than Newton's:
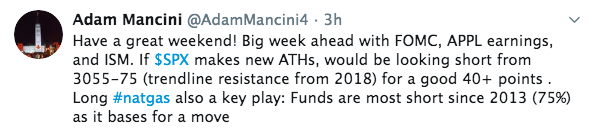
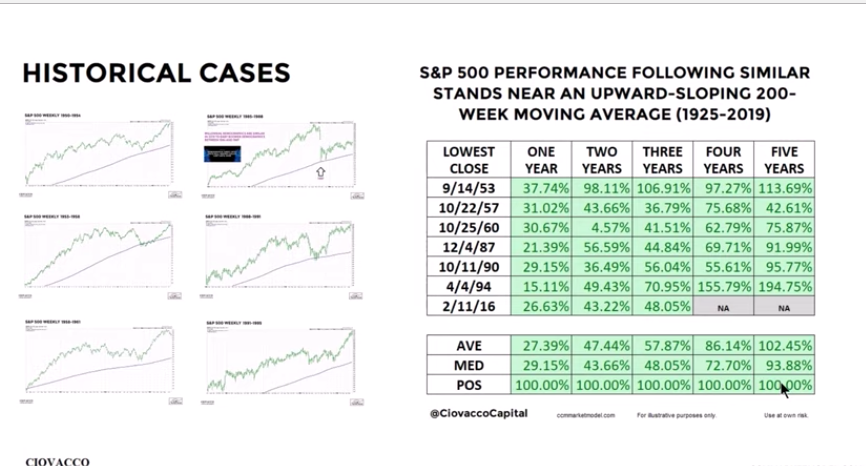
Last but not least, as it pertains to the long-term outlook for the S&P 500, it comes from the 200-week moving average. (Chart from Ciovacco Capital)
When we see this upward sloping 200-week moving average, it has historically proceeded additional gains for the S&P 500. As shown in the table below, for which a similar upward sloping 200-week moving average has happened 6 other times, the S&P 500 is up across all annual time frames over the next 5 years... 100% of the time.
As it pertains to the current period, which is historically the best time to own stocks, Goldman Sachs identifies where the S&P 500 is with respect to such seasonality in the following chart:
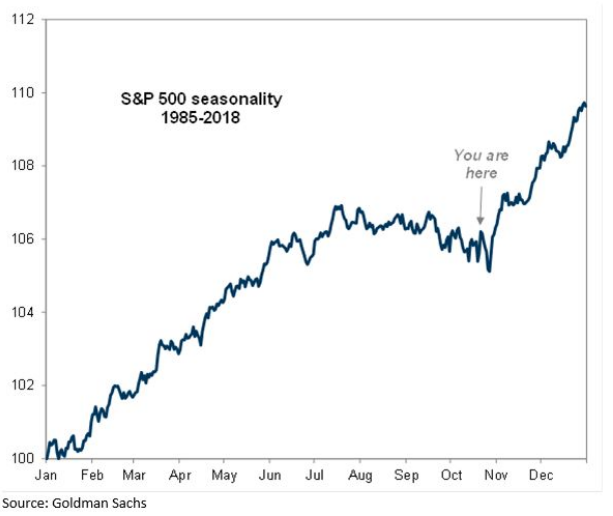
Based on the seasonal patterns, it does appear as though the October period has already lived up to its "billing" month-to-date. As such, the end of the month does suggest a down-leg into the month of November, which is typically followed by another breadth thrust and the S&P 500 surging higher into year's end.
Most measures of market breadth suggest that the S&P 500 will achieve a new all-time high near-term. Nonetheless, I don't assert Friday's S&P 500 market move as being something that changed market sentiment. The reality is that the market likely moved higher without true buying pressure. The green candle on Friday was outlined by Bloomberg as something characterized and signaled by most short squeeze occurrences.
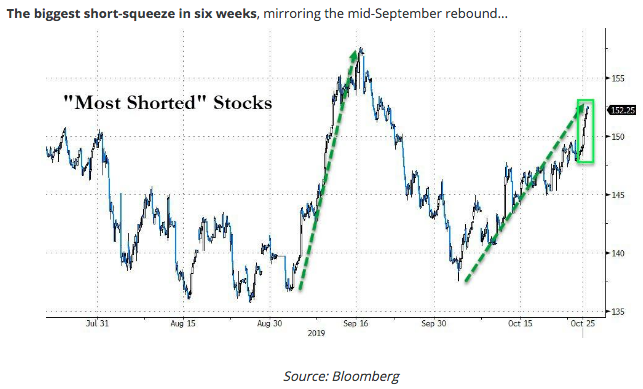
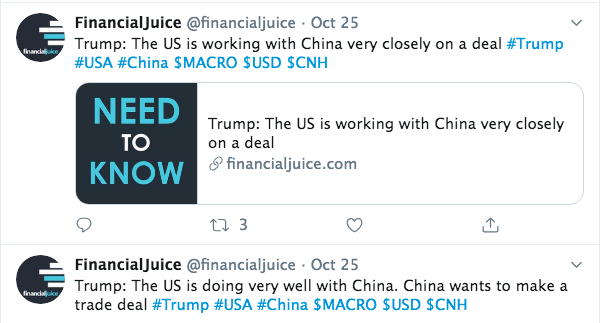
And what caused the short squeeze? Of course, it was caused by the known phone call that was to take place Friday between U.S. and China trade delegates. What wasn't known ahead of the talks, was the outcome and sentiment from the talks. It wasn't until after the call had been completed that positive headlines surrounding the call proliferated in the media.
The market is overbought, but can reside in overbought territory for a bit longer and before it starts the process of distribution and consolidation once again. Of course, from what point will the distribution take place is the unknown variable.
Finally, the weekly expected move for the past week was roughly $37+/points. And that's almost exactly where we ended the trading week that began with the S&P 500 at 2,986 and ending the week at 3,022ish. With the VIX declining some 11% on the week, we've seen the weekly expected move come down, even with so much taking place in the coming week.
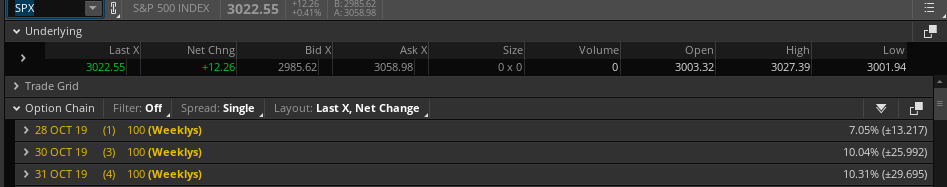
For the week ahead, the S&P 500 weekly expected move is just $29/points. This may prove to be one of those weeks where the S&P 500 extends beyond the weekly expected move, especially if the Fed is fond wanting by investors for it's messaging and outlook on both the economy and rates.
Economic Data & FOMC Meeting
The economic data continues to portray a mixed picture about the future prospects for the economy. On one hand, we have strong Housing, Labor & Employment and Retail sales data. On the other hand, we have weak manufacturing and sub-par industrial production data. The two are seemingly at odds and in need of alignment. Much of the current recession anxiety stems from "sentiment" indicators like the manufacturing ISM. There can be a difference between this "sentiment" and the actual production picture, as is the case now. Actual Industrial Production bottomed in April and has been recovering ever since, but a full upswing in Industrial production needs to take place in order to truly eliminate the recession fears.
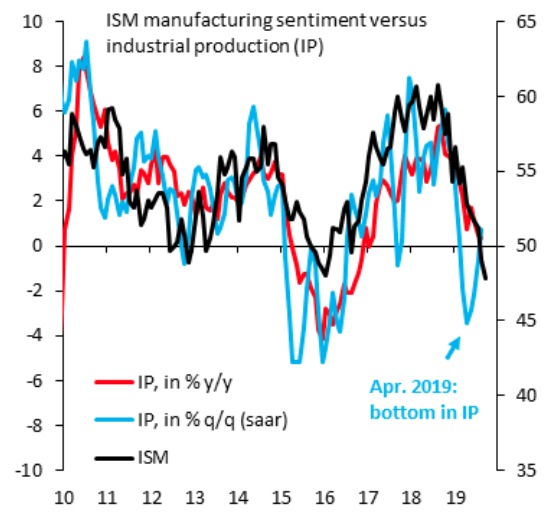
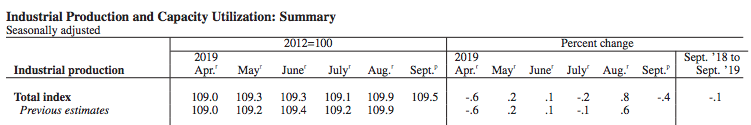
As we can see in the chart, the ISM (survey-driven sentiment/soft data) has been in decline longer than Industrial Production (hard data). Industrial production fell back 0.4% in September after advancing 0.8% in August. For the third quarter, Industrial Production rose at an annual rate of 1.2% following declines of about 2% in both the first and the second quarters. We're of the opinion that the Q1 and Q2 periods were abnormally slow due to inflated U.S. business inventories, which have since been worked down. Again, Industrial Production actually bottomed in April, as shown by the government's data and table below:
All week long I've been contemplating the ways in which a recession can occur. Based on all of our due diligence and study, we've come to the overarching understanding that there is generally only one way to bring about a recession: SHOCK THE CONSUMER! How the consumer is shocked into a state of saving rather than spending is a whole other topic. In the past, exogenous events or lack of regulation and over-leveraged assets have caused recessions. If we think about just the past 2 recessions, 2001 and 2008, they were both caused by such circumstances. The 2001 recession, which was arguably not a recession at all (2 consecutive quarters of negative GDP), was caused by an attack on the United States by a foreign entity, 9-11. The 2008 recession was caused by excess leverage, deregulation within the housing/mortgage market and CDO's that were leveraged by collateral which was never mark-to-market capable. In other words, the collateral was worthless but valued more than 40X for many CDO portfolio products. None of these issues, variables, excesses or degree of leverage exists presently in the market or in the economy. With all that said, of course, there is no way to predict a terrorist attack or something of its equivalence.
With that brief soliloquy offered, a true natural occurring recession is extremely rare to come by and one for which hasn't been seen since the 1950s and just after the WWII era. Most other recessions occur from a government policy error, which is causing much of the recession fears today. The U.S. White House Administration's trade war/economic policy is one that found economic policy uncertainty at 3-year highs back in August. It has since come off of these highs due to what appears to be an approaching "phase 1 deal" between the U.S. and China.
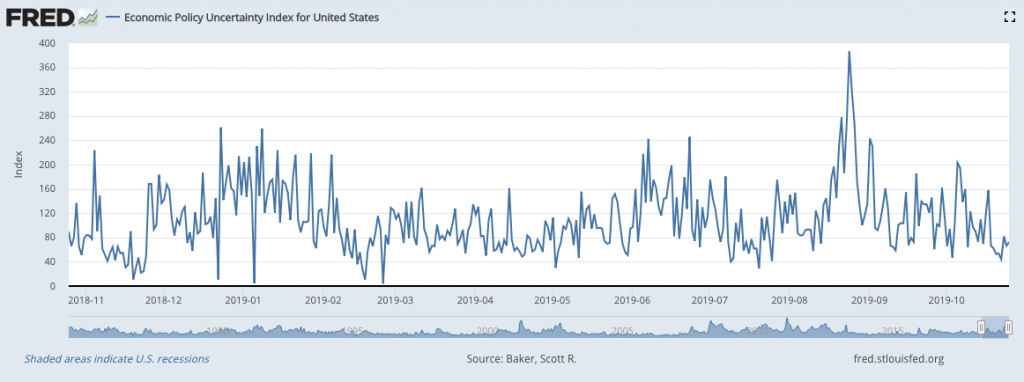
Based on the U.S. Economic Policy Uncertainty Index, we can see the steep decline of late, lending itself more favorably to investor and economic sentiment. With that being said, let's take a look at this awesome bait-and-switch proposal of economic uncertainty in the latest Zerohedge:
"Well, according to The Baker, Bloom, and Davis daily news-based Economic Policy Uncertainty Index (based on newspaper archives from Access World New's NewsBank service), US economic policy uncertainty has never, ever been higher than it is currently...
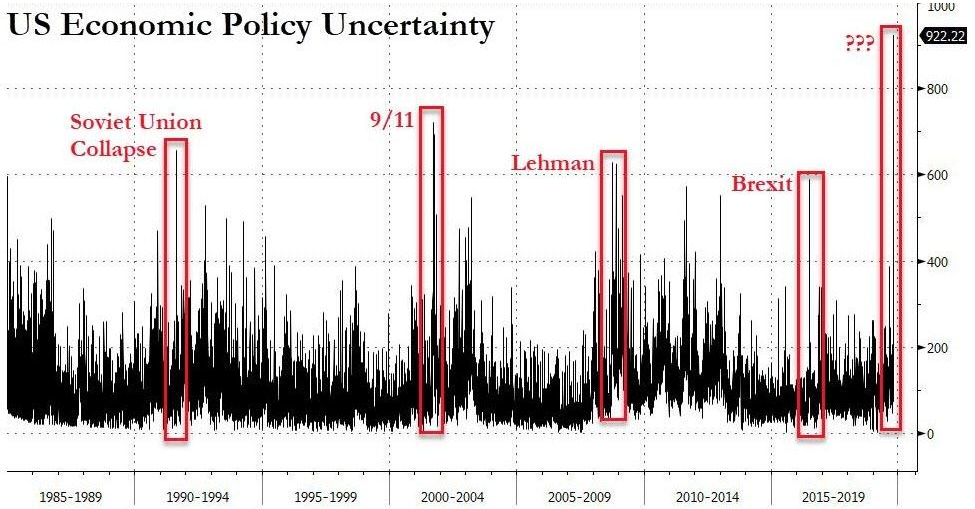
Remember folks, the founder of ZeroHedge has been banned from trading securities in the United States. No wonder! And while I can outline reality vs. what ZeroHedge manufactures to fit the publication's narrative and bias, I can also certainly suggest the trade war has taken a toll on the global and domestic economy. Trade volumes alone has looked rather abysmal, but...
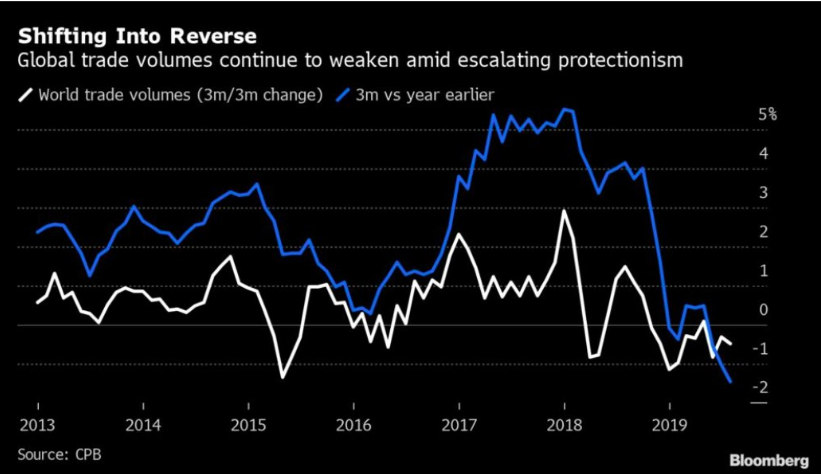
Nonetheless, with a now 15-month long trade war hopefully reaching its climactic point and de-escalating from there, we may see a rebound in global and domestic growth into and through 2020. Why do we say this you might ask? The former Global Trade chart above has been updated as of October and looks like...
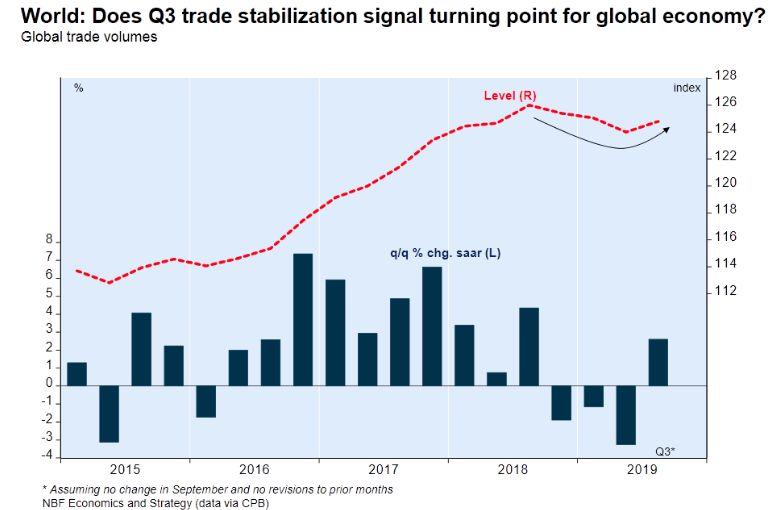
Additionally, I refer to the previous statement that I believe inventory ballooning ahead of tariff implementation needed to be worked down and has been. The consumer demand has always been there throughout the trade war, in the United States. Thus, I believe with de-escalating trade tensions and barriers, the manufacturing recession is at a trough point and set to rebound near-term if it has not already.
In conjunction with some of the regional PMI data potentially showing a bottoming, the recent Markit PMI identifies strengthening in the manufacturing and service sectors of the United States. Flash PMI data for October indicated a marginal increase in the rate of growth of business activity, supported by the fastest expansion of manufacturing production for six months. Growth of service sector activity also picked up, though rates of expansion in both sectors remained subdued.
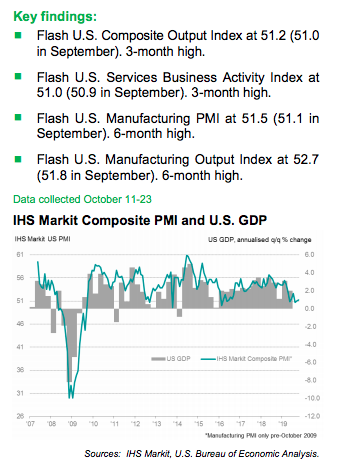
Adjusted for seasonal influences, the IHS Markit Flash U.S. Composite PMI Output Index reached 51.2 in October, up from 51.0 during September, to
signal the sharpest increase in business activity since July. The latest reading pointed to another gradual recovery in output growth from the three-and-a-half-year low seen in August.
Moreover, I'm naturally broaching the manufacturing conversation once again because in the coming week, the October ISM Manufacturing Index will be released. According to economists polled by MarketWatch, the ISM is expected to have rebounded from 47.8 to 49 in the month of October.
Aside from manufacturing data, we continue to see the Housing sector data rebound from the 2018 declines. New Home sales were reported in the past week and showed a continuation of YoY strength.
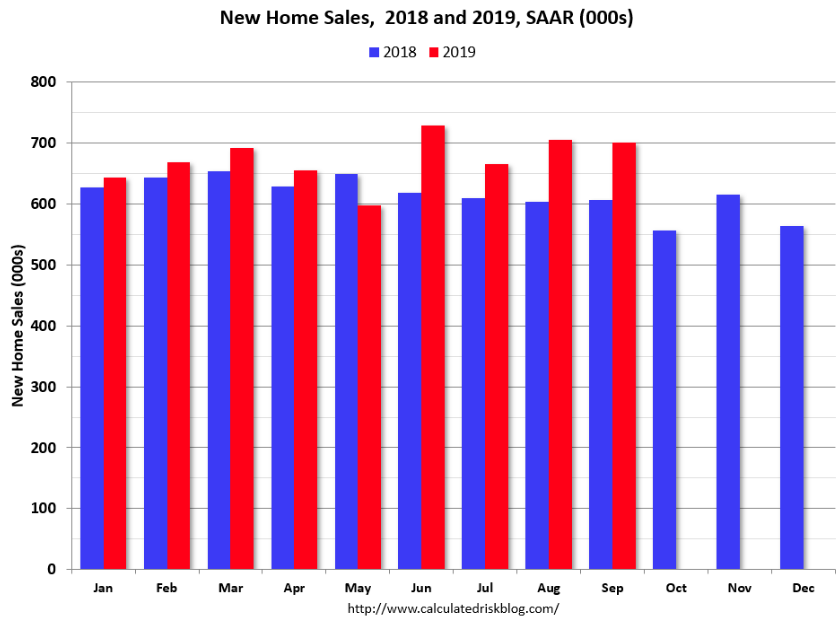
- New home sales for September were reported at 701,000 on a seasonally adjusted annual rate basis (SAAR). Sales for the previous three months were revised down slightly, combined.
- This is 0.7% below the revised August rate of 706,000, but is 15.5% above the September 2018 estimate of 607,000."
- Sales were above 700,000 SAAR in three of the last four months - the best four-month stretch since 2007.
- Annual sales in 2019 should be the best year for new home sales since 2007.
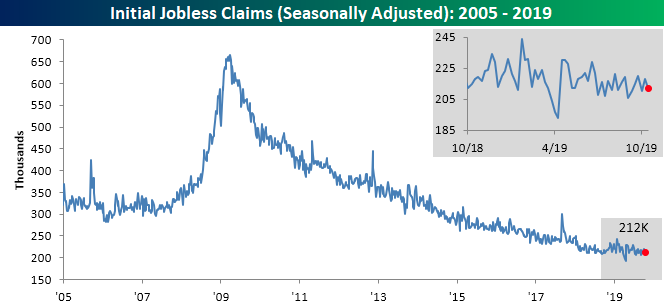
Although Durable goods orders continue to underperform the litany of economic data that is delivered each week, Initial Jobless Claims continues to outperform much of the data. Where there are jobs there is consumer spending and where there is consumer spending there is the inevitability of improved industrial production, manufacturing and Durable goods orders.
As such, I believe that the combination of lesser business inventory overhang and trade de-escalation will provide a boost in certain of the economic data going forward. Keep in mind I still anticipate a weakening of GDP and job creation to coincide with the data that has proliferated through the Q3 period.
The coming week is one that will be packed to the brim with economic data, earnings and just for fun, a Fed rate decision. The economic data calendar below from MarketWatch identifies the daily economic data releases:
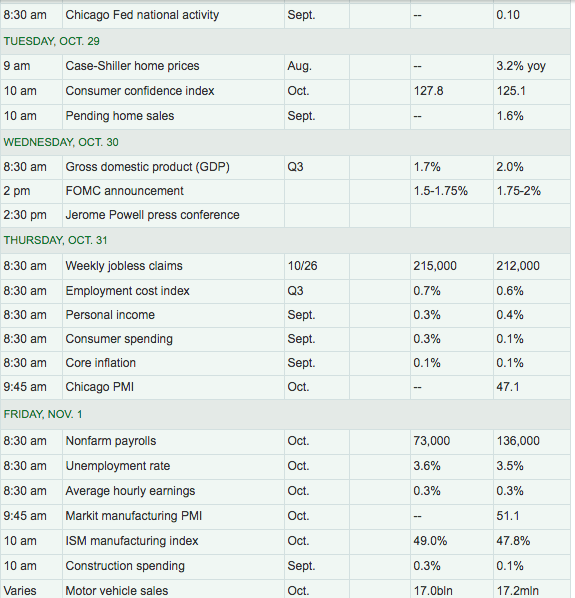
Of course, the Fed would be announcing their rate decision on Wednesday, the same day as the first look at Q3 GDP is announced, with Facebook, Apple and Starbucks reporting earnings after the closing bell on Wall Street. Ahead of these important market-moving releases will be the Consumer Confidence Index, which is expected to tick higher and from a recent drop of nearly 10 points.
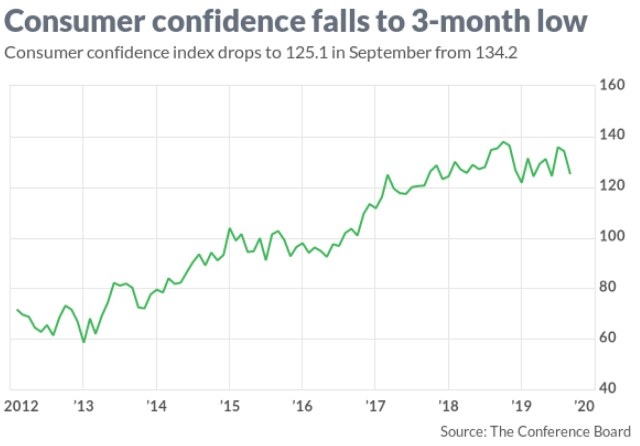
The Consumer Confidence index fell to a three-month low of 125.1 in September from 134.2 in August. Economists expect a rebound on more optimistic prospects from a U.S./China trade deal of sorts and a stock market that has been advancing toward new highs.
Beyond Consumer Confidence, the day after the Fed is expected to cut rates another 25 basis points, Personal Income and Expenditures (PCE) is due for release. After a subpar retail sales print for September, investors will most likely focus on the Consumer Spending component of the PCE data. And on Friday...
If it's the first Friday of the month that means it's "jobs Friday". The Bureau of Labor and Statistics will release the Nonfarm Payroll data on Friday. Expectations are quite low. This is the first sub-100,000 job creation month we can recall from the current expansion cycle. Job growth is expected to be weak after showing a 50-year low in the unemployment rate last month (3.5%) and with a reduction in retail sector employment and the ongoing UAW labor-strike. Bank of America Merrill Lynch says the GM-UAW strike likely depressed October Nonfarm payroll growth to 25k, which is far below the current economists' expectations of right around 73,000 jobs.
The good news is that the Fed will be cutting rates. The bad news is that they have to find a way to deliver bad news, in a good/amicable way for which the market doesn't find itself in a panic. According to Goldman Sachs' economists, the Fed will be delivering 2 messages in fact:
- Fed officials are likely to say this is the end of the “mid-cycle” adjustment that Chairman Jerome Powell alluded to in July.
- In addition, the central bank could remove the language stating it will “act as appropriate to sustain the expansion” that has been in play since June.
“Strong signaling from Fed leadership indicates that the modest trade war de-escalation since September has not deterred them from completing a 75bp, 1990s-style ‘mid-cycle adjustment,’” Goldman economist Spencer Hill said in a note to clients.
Indeed, the market has priced in a near 100% probability of a rate cut come this Wednesday. And what the market wants, the market ultimately gets. It's an absolute certainty based on the facts and figures going back to at least the start of the current expansion cycle. (Stats from Pension Partners)
- 83 FOMC meetings since expansion began.
- 72 meetings: Market priced in no rate change & no change.
- 9 meetings: Market priced in 25 bps hike & Fed hiked 25 bps.
- July 2019 & Sept 2019: Market priced in 25 bps cut & Fed cut 25 bps.
- Not one surprise.
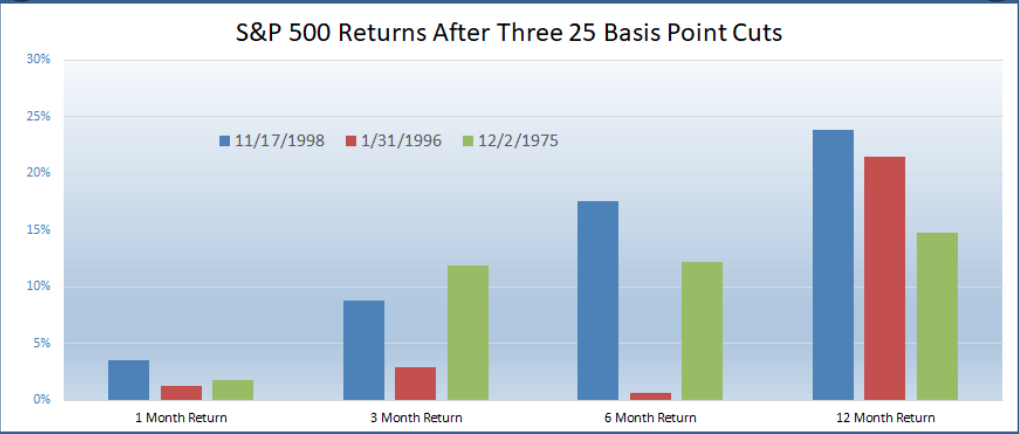
Fortunately, when the Fed rate cuts have been 25 bps rate cuts and determined to be "insurance" cuts, the economy hasn't needed much more than that. The following chart, from LPL Financial, identifies periods of insurance cuts and how the S&P 500 performed over the next 12-month period. Not too shabby, huh? But remember, history does not always repeat itself.
Getting back to the Goldman Sachs' notes on the Fed's 2 messages...
“We expect the ‘act as appropriate’ sentence to be replaced with a reference to the easing actions already delivered (mirroring the language in October 2007 and June 2008) coupled with the following less committal guidance: ‘will act as needed to promote its objectives.
Chair Powell will have a fine line to walk during the press conference if he hopes to satisfy market participants projecting additional easing as well as the critics of insurance cuts — both on and off the Committee,” Hill said “Reflecting this, we expect a slightly hawkish tone, with Powell alluding to a baseline of unchanged policy but emphasizing data-dependence and the ability to respond quickly if the outlook deteriorates.”
I don't share the opinion from Goldman Sachs regarding the removal of "act as appropriate". We believe both of the messages ("end of mid-cycle" and removal "act as appropriate") occurring in the same FOMC meeting may prove too much for markets to absorb and therefore best if the FOMC split the messages through year-end meetings. By not splitting the deliveries of these messages into separate meetings, the Fed runs the chance of another misstep in messaging, something we would be of the opinion they desire to avoid. Additionally, the FOMC meeting is coming on a day whereby the Q3 GDP report will be delivered and if that proves worse than the median economists' expectations... well, the Fed would be wise to tread very dovishly with its message/s. Nonetheless, I can't suggest the probability of both messages taking place at the October meeting is off the table. The Jerome Powell led FOMC has been known for their missteps in messaging.
Speaking of those missteps in messaging and Jerome Powell's track record of dissatisfying investors, the following chart maps out the S&P 500's performance on Fed days under the leadership of Jerome Powell. SPOILER ALERT... IT AIN'T GOOD FOLKS!!
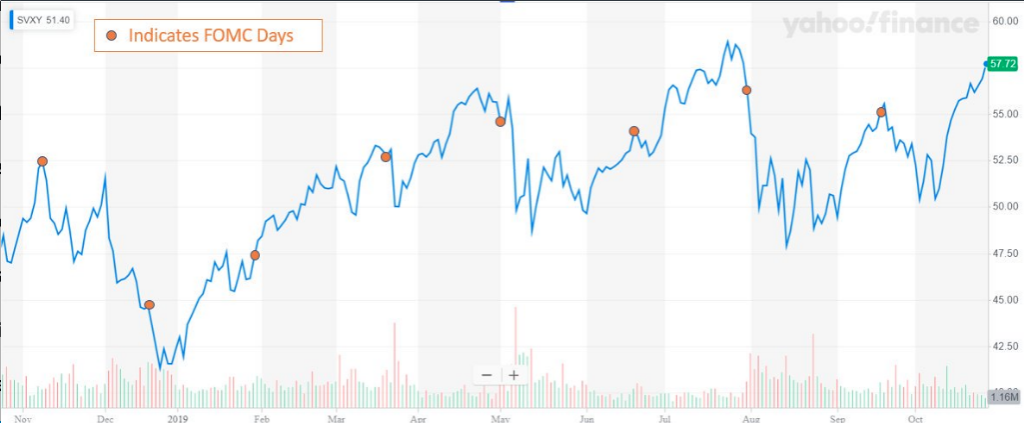
Nearly anything can serve as an excuse for stocks to pull back some gains after a good run, and this includes an unsurprising decision from the Fed. And perhaps if Powell signals that the Fed will go on hold for a while after this meeting, it might cause a flutter through stock and bond portfolios. And if it does, if the Fed does create a market stir... This doesn't change the outlook for the economy going forward and now with even more favorable financial conditions that support interest rate-sensitive sectors of the economy. And least we not forget, the Fed is still expanding its balance sheet folks.
With all the economic data to be delivered and angst over the Fed rate announcement and policy statement, at the very least, investors should anticipate a pick up in market volatility in the week ahead. If a market pullback ensues, we refer to our prior statement on characterizing the financial conditions and a trend-growth economy. We believe pullbacks are long-term buying opportunities for investors as the expansion cycle rolls into 2020 with the potential for an earnings rebound to commence. With that said, the following Q3 GDP expectations are noted and all reside below 2 percent.
- From Merrill Lynch: We expect the advance 3Q GDP report to reveal moderation in growth to 1.5% qoq saar from 2.0% in 2Q. [Oct 25 estimate] emphasis added
- From Goldman Sachs: We left our Q3 GDP tracking estimate unchanged at +1.6% (qoq ar). [October 24 estimate]
- JPMORGAN: Durable-goods report (and negative revision) “was a disappointment for September, lowering our tracking for 3Q US GDP growth by a tenth to 1.4%.
- From the NY Fed Nowcasting Report: The New York Fed Staff Nowcast stands at 1.9% for 2019:Q3 and 0.9% for 2019:Q4. [Oct 25 estimate]
- From the Atlanta Fed: GDPNow: The GDPNow model estimate for real GDP growth (seasonally adjusted annual rate) in the third quarter of 2019 is 1.8 percent on October 24 [Oct 24 estimate]
Earnings Outlook
The good news surrounding the earnings outlook for Q3 2019 is that the estimates I had assumed would be positively revised by FactSet and Refinitiv have indeed been positively revised. So let's go to the "tape", as they say.
According to FactSet, to-date, 40% of the companies in the S&P 500 have reported actual results for Q3 2019. In terms of earnings, the percentage of companies reporting actual EPS above estimates (80%) is above the five-year average. In aggregate, companies are reporting earnings that are 3.8% above the estimates, which is below the five-year average. In terms of sales, the percentage of companies (64%) reporting actual sales above estimates is above the five-year average. In aggregate, companies are reporting sales that are 1.1% above estimates, which is also above the five-year average.
- The blended earnings decline for the third quarter is -3.7%, which is smaller than the earnings decline of -4.8% last week. Positive earnings surprises reported by companies in multiple sectors (led by the Information Technology sector) were responsible for the decrease in the overall earnings decline during the week.
- Looking ahead, analysts see slight earnings growth in the fourth quarter followed by mid-to-high single-digit earnings growth for Q1 2020 and Q2 2020. The forward 12-month P/E ratio is 17.0, which is above the five-year average and above the 10-year average.
- During the upcoming week, 156 S&P 500 companies (including six Dow 30 components) are scheduled to report results for the third quarter.
I anticipate a continued positive revision streak from FactSet as the Q3 reporting season rolls forward. With that in mind, a similar positive revision to the Q3 EPS outlook was offered from Refinitiv on this Friday past. Please see there outlook below:
Aggregate Estimates and Revisions
- Third-quarter earnings are expected to decrease 2.0% from 18Q3. Excluding the energy sector, the earnings growth estimate is 0.5%.
- Of the 199 companies in the S&P 500 that have reported earnings to date for 19Q3, 78.4% have reported earnings above analyst expectations. This compares to a long-term average of 65% and prior four-quarter average of 74%.
- 19Q3 revenue is expected to increase 3.4% from 18Q3. Excluding the energy sector, the growth estimate is 4.6%.
- 60.9% of companies have reported 19Q3 revenue above analyst expectations. This compares to a long-term average of 60% and an average over the past four quarters of 59%.
- The estimated earnings growth rate for the S&P 500 for 19Q4 is 2.2%. If the energy sector is excluded, the growth rate improves to 4.5%. The S&P 500 expects to see share-weighted earnings of $345.6B in 19Q4, compared to share-weighted earnings of $338B (based on the year-ago earnings of the current 505 constituents) in 18Q4.
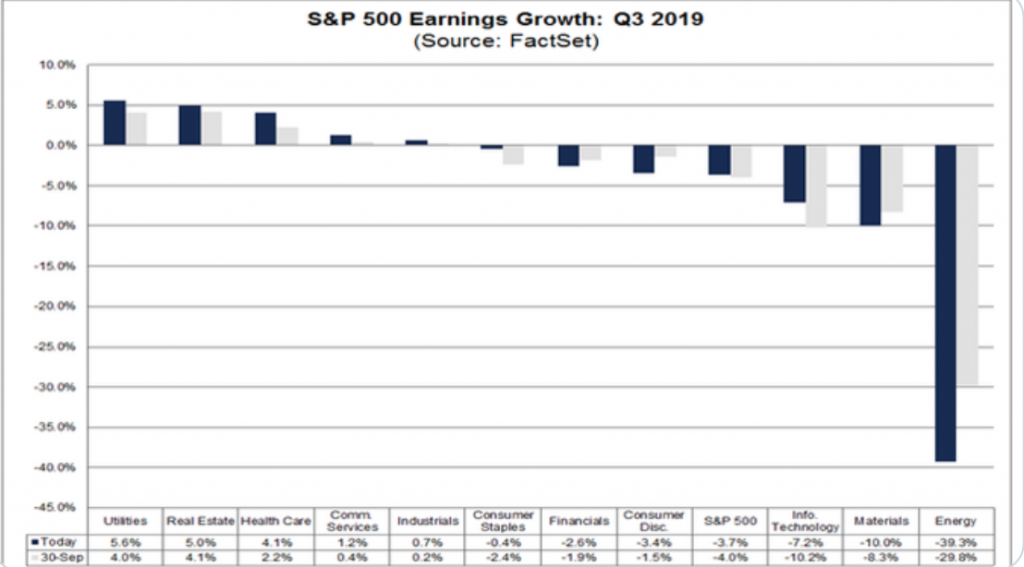
- Eight of the 11 sectors in the index expect to see an improvement in earnings relative to 18Q4. The utilities and financials sectors have the highest earnings growth rates for the quarter, while the energy sector has the weakest anticipated growth compared to 18Q4
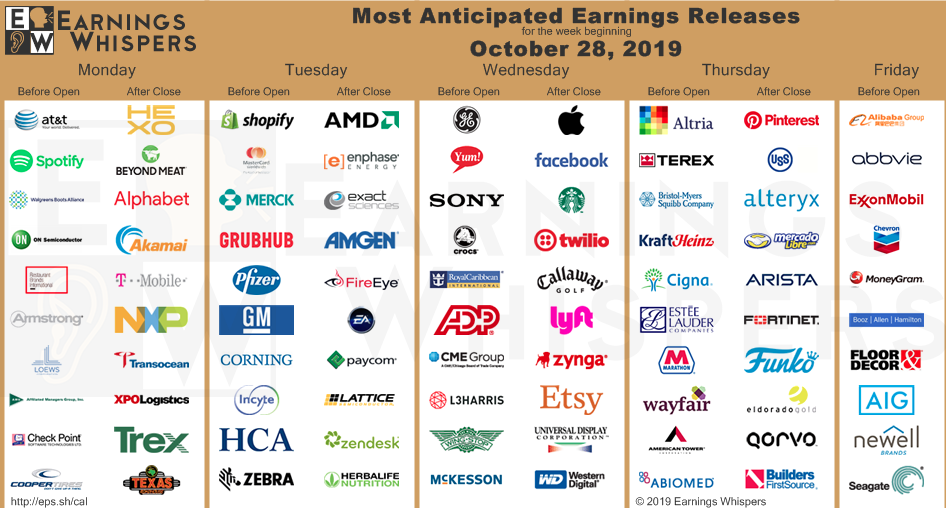
For the coming trading week, here is a screenshot of the daily and most anticipated earnings reports offered by Earnings Whisper. Least we not forget, Alphabet (GOOGL) will be first up to bat with their earnings release on Monday, after the closing bell.
During the trading week, I discussed many aspects of market seasonality with Finom Group members (for who I am employed). One such aspect ties together my earnings outlook conversation. The fourth quarter is typically the time of year we witness 2020 EPS estimates come down. While this sounds bearish for the S&P 500, it's actually proven bullish going forward when coupled with an economic expansion cycle. In fact, the only two down years during the expansion cycle have come in 2011 and 2018, both years witnessed EPS estimates rise for the calendar year. All other years saw EPS estimates lowered and with the S&P 500 rallying forward. With that being said, we are finding analysts taking a knife to their 2020 profit estimates just when the S&P500 is about to set a new record. Analysts just cut S&P 500 estimates by the most since January of 2019.
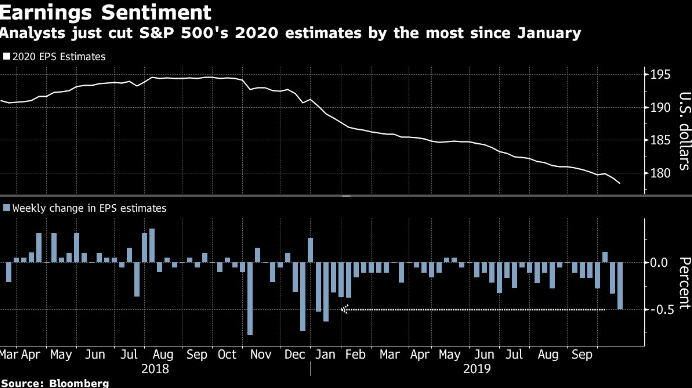
Despite a week of pretty good results, analysts last week chopped estimates for combined S&P 500 earnings in 2020 by almost $1, to $178.40 a share. Down 0.5%, the decline was the biggest for any week since January, data compiled by Bloomberg showed.
To be sure, analysts almost always over-estimate future earnings and lower their forecasts as a period draws near. And S&P 500 profits are still projected to expand 10% in 2020, compared with 1.9% this year. But amid memories of last year’s market collapse, in which forecasts peaked in September and then started an 8% slump, the bulls need next year’s estimates to stand up if this year's rally is to last into 2020.
DataTrek Research’s co-founder Nick Colas is among those who think analysts’ estimates have to come down a lot from current levels. Sales growth will be subdued, coming in between 3% and 4%, he estimated. Margin pressures, like higher wages and input costs, will “eat up” all those gains, making for 2020 profits that “essentially mirror” this year’s, at $163 a share, he wrote to clients. That would mean virtually no growth.
For now, that risk doesn’t seem to be scaring investors, thanks to a global effort from central banks to supply markets with liquidity and sustain growth. For Mike Wilson, chief U.S. equity strategist with Morgan Stanley, it’s only a matter of time for the reality to sink in with investors, he says. His model on earnings revisions suggested the S&P 500 would have been flat in the past 12 months, as opposed to an actual 6% increase.
“This reflects the very aggressive shift in monetary policy recently by the Fed and other central banks -- i.e. that policy change is priced,” Wilson wrote in a note. “However, once the market gets past the initial relief it will have to contend with the deteriorating fundamentals.”
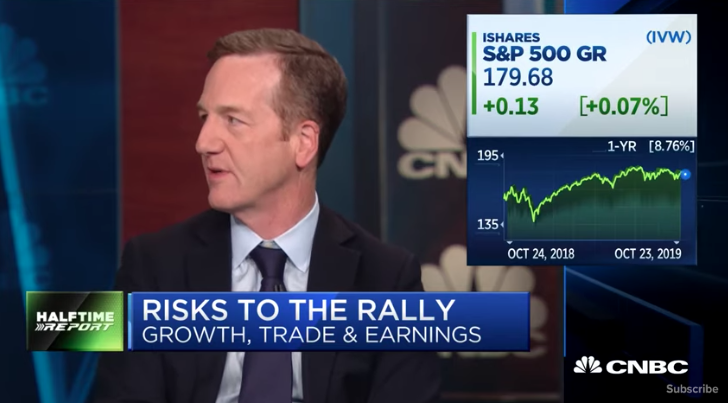
In a recent CNBC interview, Wilson suggested the economy needed a recession to forcibly cleanse the market from its' unsustainable valuation. While I don't agree with Wilson's outlook, I can understand the fear of faltering earnings growth that is still assumed out in 2020 by investors and analysts alike. Finom Group is of the opinion that Wilson is overlooking the inventory overhang story, a byproduct of the trade war that has maligned the domestic and global economy throughout 2019. We also believe there is the potential that with improved trade relations, the headwind of the strong U.S. Dollar and weak crude oil prices will alleviate and bring about tailwinds for corporate profits in 2020. Of course, I emphasize, WITH IMPROVED TRADE RELATIONS!
Wilson's year-long bearish narrative and now rhetoric surrounding a recession seems misplaced given that which has caused a global growth slowdown may soon dissipate. The U.S./China trade war may have already peaked in terms of tariffs and now prove to de-escalate. If a proposed phase 1 deal coincides with already easing central banks around the world, the "lower-for-longer" interest rate regime has the ability to reaccelerate global growth into and through 2020 as greater economic clarity comes to the forefront and business investment returns.
Moreover, Wilson might find himself increasingly on an lonesome island with his latest recession hopes. The most recent BofAML Fund Manager Survey has shown an improvement amongst those who have been fearing a recession in 2020.
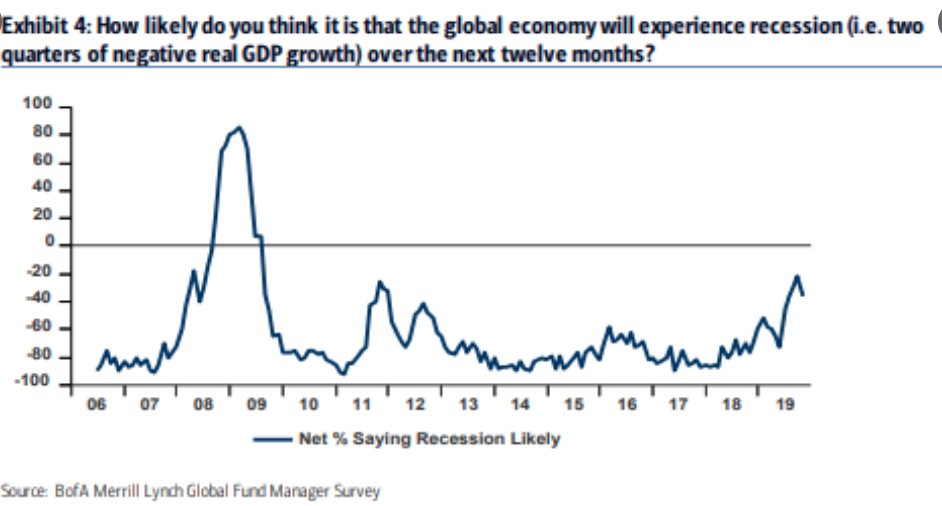
The net percentage of fund managers fearing a recession had been the highest in years this summer, but managers have recently become slightly more optimistic. Many are projecting an increase in global growth in 2020 because of a boost in emerging markets. This may be due to recent trade developments between the U.S. and China. While a phase 1 trade deal is widely anticipated by economists and market participants to take place by mid-November, very few anticipate the removal of employed tariffs.
Jefferies analysts Christopher Wood, however, says existing tariffs could be unexpectedly dropped if a trade deal is reached, resulting in a rally in global stocks. He said: “Almost no one is expecting this, but this is what should happen should a deal be agreed since the tariffs were put in place by the Trump administration as leverage in a negotiation.”
China has reportedly asked for planned and existing tariffs to be dropped in exchange for buying more U.S. agricultural goods. Wood said he was increasingly optimistic of a U.S.-China trade deal this quarter, but that the key question was whether that would be a “minideal” or something more substantial in the form of tariffs being dropped. Finom Group is of the opinion, that the probability of the September tariffs being repealed has increased in recent weeks.
Investor Takeaways
U.S./China trade relations will loom in the background for market participants as earnings season moves forward. Even so, most economists remain skeptical of any near-term deal. According to a recent Reuters survey, a majority of economists, 27 of 45, said U.S.-China trade relations would stay about the same between now and the end of next year. The others were evenly split between it getting better or worse.
“Encouraging, but we are mindful a successful resolution is still a long way away and the negotiations will continue to ebb and flow over the coming year,” said Sam Bullard, senior economist at Wells Fargo, referring to the latest U.S.-China trade developments."
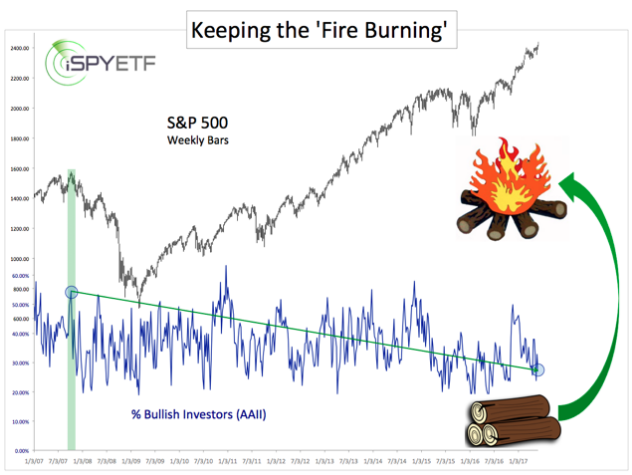
The pessimism is palpable but has proven a tailwind for markets throughout 2019's equity market rally. If everyone is bearish and knows a market crash is coming, then why isn't the market crashing? A watched pot doesn’t boil and a watched bubble doesn’t burst. There will be a correction, but the bull market won’t be over until most bears turn into bulls or the media stops listening to crash-prophets. The bears have been nothing but fuel adding to the market fire over the last several years. We can offer the following depiction or animation of this sentiment in the following animation of the S&P 500 vs. the AAII survey.
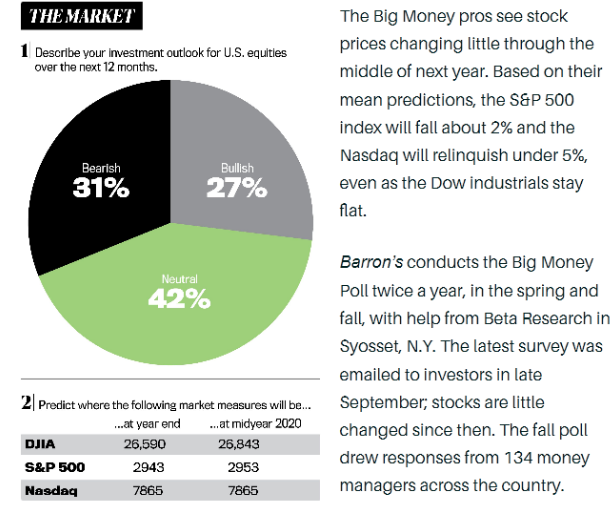
The AAII survey results find bullish sentiment still remains below the historical average. Additionally, that same pessimism has been mirrored with the most recent Barron's survey. Barron's fall 2019 Big Money Poll shows that bullish sentiment continues to underperform, even as the market marches back toward record levels.
"After a big year for U.S. stocks—make that a big 10 years—America’s money managers see trouble ahead for investors. Blame it on the market’s lofty valuation, a muddled economic outlook, or the increasingly fractious political landscape, any of which could stifle stocks’ advance in coming months. Whatever the case, only 27% of money managers responding to Barron’s fall 2019 Big Money Poll call themselves bullish about the market’s prospects for the next 12 months, down from 49% in our spring survey and 56% a year ago. The latest reading is the lowest percentage of bulls in more than 20 years."
With the notable pessimism plaguing investors throughout 2019, the coming trading week is not likely to find much optimism given the plethora of significant earnings and economic data reports that coincide with an FOMC rate announcement. I've seen this movie before, with Jerome Powell at the head of the Fed and it often hasn't played out well for markets. Having said that, there are a few reasons to think the market isn’t especially vulnerable this particular Fed meeting when compared to the past.
For one thing, stocks have advanced over the past two months without rising expectations for incremental Fed easing and without an outsized reliance on defensive “bond substitute stocks.” In recent weeks, stocks more geared to a reaccelerating global economy, financials, industrials, materials, small-caps and even semiconductors have been outperforming growth and staples stocks. This suggests the market is watching that leading indicators of industrial production activity, which I outlined earlier, curling higher and betting that the expansion has legs into 2020.
While these market characteristics seem favorable going into a Fed meeting and rate announcement, investors might prove cautious nonetheless and find protection in cost-effective VIX options early on in the coming trading week. Speaking of protection...
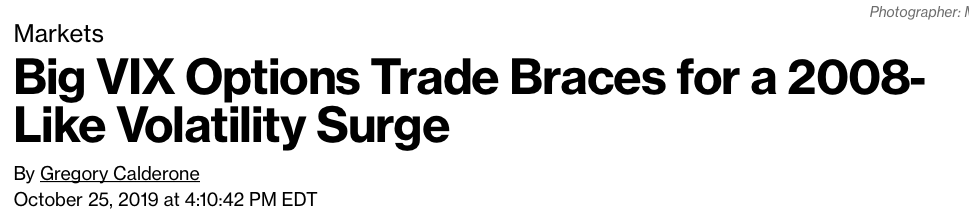
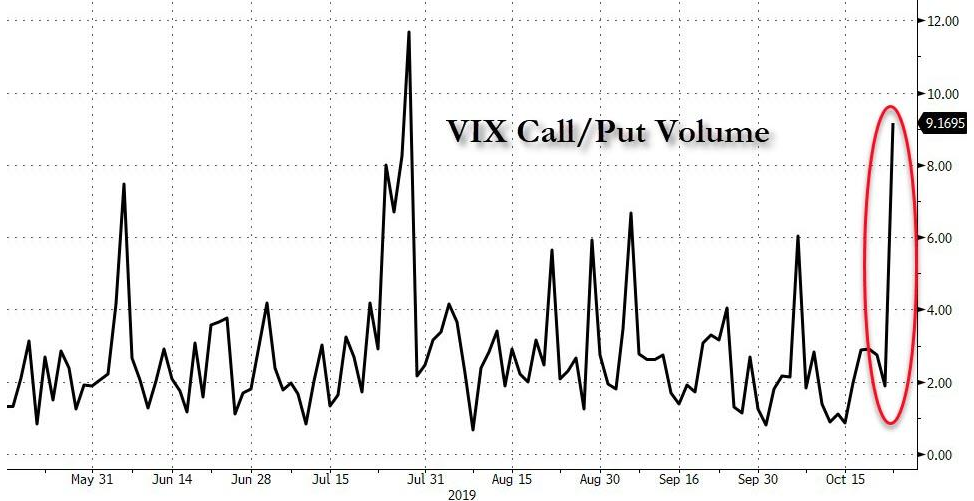
The VIX has fallen for 3 consecutive weeks, while the S&P 500 has risen. This is what we expect to see express in the inverse relationship of the 2 key indexes. With the VIX decaying to a 12 handle on Friday, one trader took advantage of the "cheap" protection costs to place a huge bet on the market descending into the kind of chaos not seen since the global financial crisis. As Bloomberg reports, trading in call options on the VIX outweighed puts by more than 9-to-1 earlier this past trading week and as the index came down to its lowest level since July.
The trade or protection initiated was one block of 50,000 April $65 calls that were bought for 10 cents (for a total costs of $500,000). Macro Risk Advisors derivatives strategist Maxwell Grinacoff said the April expiration date is even more interesting. That time frame could capture the impact of a potential recession, a breakdown in U.S.-China trade talks and a variety of political risks linked to the Democratic presidential primary and impeachment proceedings against Donald Trump.
This bet on volatility seems ominous, but it's a movie that I've seen many a time before and proving itself less profitable than market participants would otherwise assume. The so-called "50 cent trader" has a dubious track record with these big outsized bets in market volatility as represented in the chart from Sentiment Trader. The history of the "mysterious VIX call buyer" headlines shows mostly losers, with only a couple of big winners.
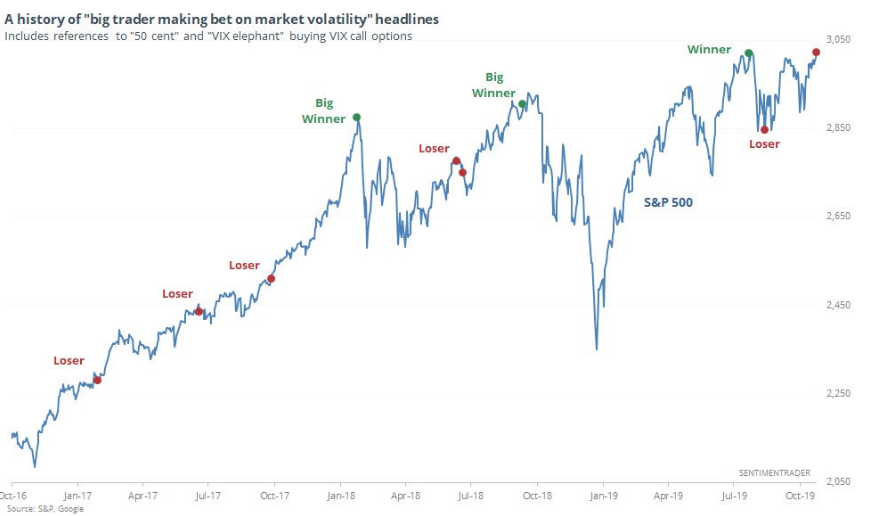
For each of these headline breaking trades from the 50 cent trader, only 3 of the previous 8 have proven profitable. This is typical of long-VOL positioning. And with respect to the outsized VIX call buying volume noted previously, here's how the S&P 500 performed after other days when VIX options volume was heavily skewed toward calls.
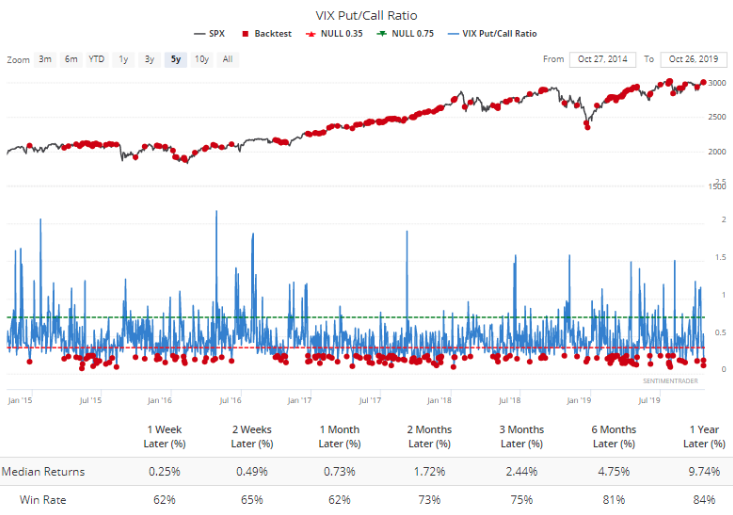
Turns out, the market is higher more than 60% of the time across all time frames out at least 12 months. With all this being said about the VIX, we can't help but to recognize the current low reading may begin to show a divergence with its typical inverse S&P 500 correlation. At these levels, and as seen in the notable trade initiated, protection becomes cheap with the S&P 500 approaching record levels. As such, we can expect that even if the S&P 500 trends higher and breaks out, the VIX may move higher as well.
I outlined in a recent tweet and inside the Finom Group Trading Room a reduction in the Golden Capital Portfolio, core VXX holdings. The reduction was in keeping with the fund's long-term strategy to cull profits from positions that are in the 90% profit profile. The fund's current short-VOL exposure between VXX and UVXY holdings stands at 11.5%, below it's historic average weighting. The weighting is anticipated to increase near-term through scalp trading efforts.


