
Here are the latest charts and statistics for the Commitment of Traders (COT) reports data published by the Commodities Futures Trading Commission (CFTC).
The latest COT data is updated through Tuesday ,March 28th and shows a quick view of how large traders (for-profit speculators and commercial hedgers) were positioned in the futures markets.
Weekly Speculator Changes led by 10-Year Bonds & SOFR 3-Months
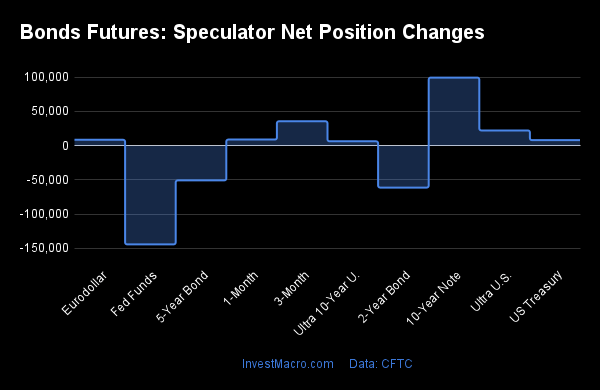
The COT bond market speculator bets were higher this week as six out of the nine bond markets we cover had higher positioning while the other three markets had lower speculator contracts.
Leading the gains for the bond markets was the 10-Year Bonds (99,451 contracts) with the SOFR 3-Months (35,598 contracts), the Ultra Treasury Bonds (22,186 contracts), Eurodollar (8,563 contracts), US Treasury Bonds (8,014 contracts), and the Ultra 10-Year Bonds (6,322 contracts) also seeing positive weeks.
The bond markets with declines in speculator bets for the week were the Fed Funds (-144,248 contracts), the 2-Year Bonds (-61,280 contracts) and the 5-Year Bonds (-50,787 contracts) also having lower bets on the week.
10-Year Bond Speculator bets improve to best level in 11-weeks
Highlighting the COT bond’s data this week is the recent improvement of the speculator positioning in the 10-Year Bonds contracts. Large speculative positions for the 10-Year Bonds rose this week by the largest amount of the past 27 weeks and the weekly bets have now been higher in three out of the past five weeks as well as five out of the past seven weeks.
The 10-Year Bond speculator net positions, overall, have been in a continuous bearish position for the past 76 weeks (since October of 2021). The bearish bets have accelerated over the past year in conjunction with the Federal Reserve’s interest rate hiking campaign to tame inflation. The 10-Year Bonds spec position recently hit a 230-week low of -627,947 contracts on February 28th, marking the lowest level dating back to October of 2018 and potentially the low for this cycle.
Since then, the 10-Year Bond speculator positions have taken +156,369 contracts off of the bearish standing and leveled this week at a total of -471,578 contracts which marks the least bearish level of the past eleven weeks. The 10-Year Bond’s speculator strength score level remains depressed in a bearish-extreme standing of 19.3 percent (compared to its 3-year range) but its 6-week strength score trend has shown an improvement by 11.3 percent.
The 10-Year Bond futures price dipped this week after showing gains in the previous four straight weeks. The front month futures price closed at approximately the 114.30 level, just below its 50-day moving average but up over 4 percent from the 2023 low of 110.125.
|
Mar-28-2023
|
OI
|
OI-Index
|
Spec-Net
|
Spec-Index
|
Com-Net
|
COM-Index
|
Smalls-Net
|
Smalls-Index
|
|---|---|---|---|---|---|---|---|---|
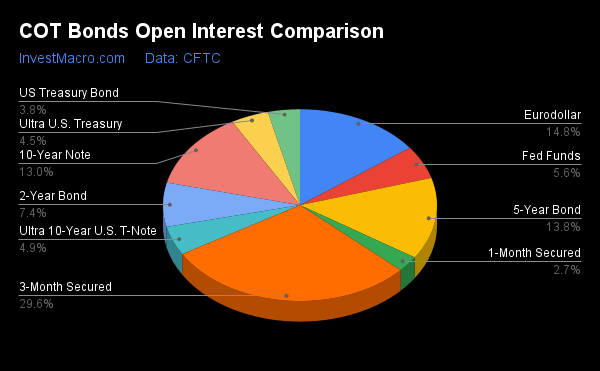
| Eurodollar | 4,708,992 | 0 | -629,408 | 58 | 815,499 | 41 | -186,091 | 64 |
| 5-Year | 4,378,900 | 99 | -682,355 | 6 | 628,178 | 83 | 54,177 | 96 |
| 10-Year | 4,127,917 | 74 | -471,578 | 19 | 436,497 | 68 | 35,081 | 92 |
| 2-Year | 2,356,318 | 52 | -525,477 | 22 | 504,395 | 78 | 21,082 | 66 |
| FedFunds | 1,779,647 | 70 | -168,600 | 19 | 174,033 | 81 | -5,433 | 80 |
| Long T-Bond | 1,201,699 | 58 | -91,399 | 55 | 21,686 | 18 | 69,713 | 100 |
Strength Scores led by SOFR 3-Months & Eurodollar
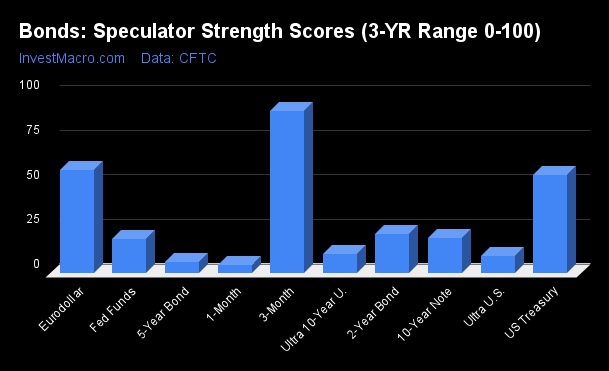
COT Strength Scores (a normalized measure of Speculator positions over a 3-Year range, from 0 to 100 where above 80 is Extreme-Bullish and below 20 is Extreme-Bearish) showed that the SOFR 3-Months (91 percent) and the Eurodollar (58 percent) lead the bond markets this week. The US Treasury Bonds (55 percent) comes in as the next highest in the weekly strength scores.
On the downside, the 5-Year Bonds (6 percent), the Ultra Treasury Bonds (9 percent), the Ultra 10-Year Bonds (11 percent), the Fed Funds (18.8 percent) and the 10-Year Bonds (19 percent) came in at the lowest strength levels currently and are all in Extreme-Bearish territory (below 20 percent).
Strength Statistics:
Fed Funds (18.8 percent) vs Fed Funds previous week (36.6 percent)
2-Year Bond (21.8 percent) vs 2-Year Bond previous week (29.6 percent)
5-Year Bond (6.1 percent) vs 5-Year Bond previous week (12.2 percent)
10-Year Bond (19.3 percent) vs 10-Year Bond previous week (7.0 percent)
Ultra 10-Year Bond (10.6 percent) vs Ultra 10-Year Bond previous week (9.3 percent)
US Treasury Bond (54.8 percent) vs US Treasury Bond previous week (52.2 percent)
Ultra US Treasury Bond (9.4 percent) vs Ultra US Treasury Bond previous week (0.0 percent)
Eurodollar (57.9 percent) vs Eurodollar previous week (57.7 percent)
SOFR 3-Months (90.7 percent) vs SOFR 3-Months previous week (87.8 percent)
SOFR 3-Months & US Treasury Bonds top the 6-Week Strength Trends
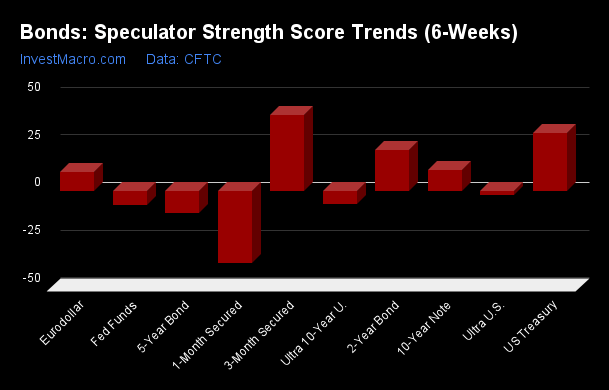
COT Strength Score Trends (or move index, calculates the 6-week changes in strength scores) showed that the SOFR 3-Months (40 percent) and the US Treasury Bonds (31 percent) lead the past six weeks trends for bonds. The 2-Year Bonds (22 percent) are the next highest positive movers in the latest trends data.
The 5-Year Bond (-11.2 percent) and the Fed Funds (-7 percent) lead the downside trend scores currently with the Ultra 10-Year Bonds (-6 percent) and the Ultra Treasury Bonds (-2 percent) following next with lower trend scores.
Strength Trend Statistics:
Fed Funds (-6.9 percent) vs Fed Funds previous week (5.2 percent)
2-Year Bond (21.8 percent) vs 2-Year Bond previous week (24.8 percent)
5-Year Bond (-11.2 percent) vs 5-Year Bond previous week (4.5 percent)
10-Year Bond (11.3 percent) vs 10-Year Bond previous week (1.8 percent)
Ultra 10-Year Bond (-6.4 percent) vs Ultra 10-Year Bond previous week (-6.7 percent)
US Treasury Bond (30.5 percent) vs US Treasury Bond previous week (26.5 percent)
Ultra US Treasury Bond (-1.9 percent) vs Ultra US Treasury Bond previous week (-10.3 percent)
Eurodollar (10.3 percent) vs Eurodollar previous week (10.2 percent)
SOFR 3-Months (40.2 percent) vs SOFR 3-Months previous week (10.2 percent)
Individual Bond Markets:
Eurodollars Futures:
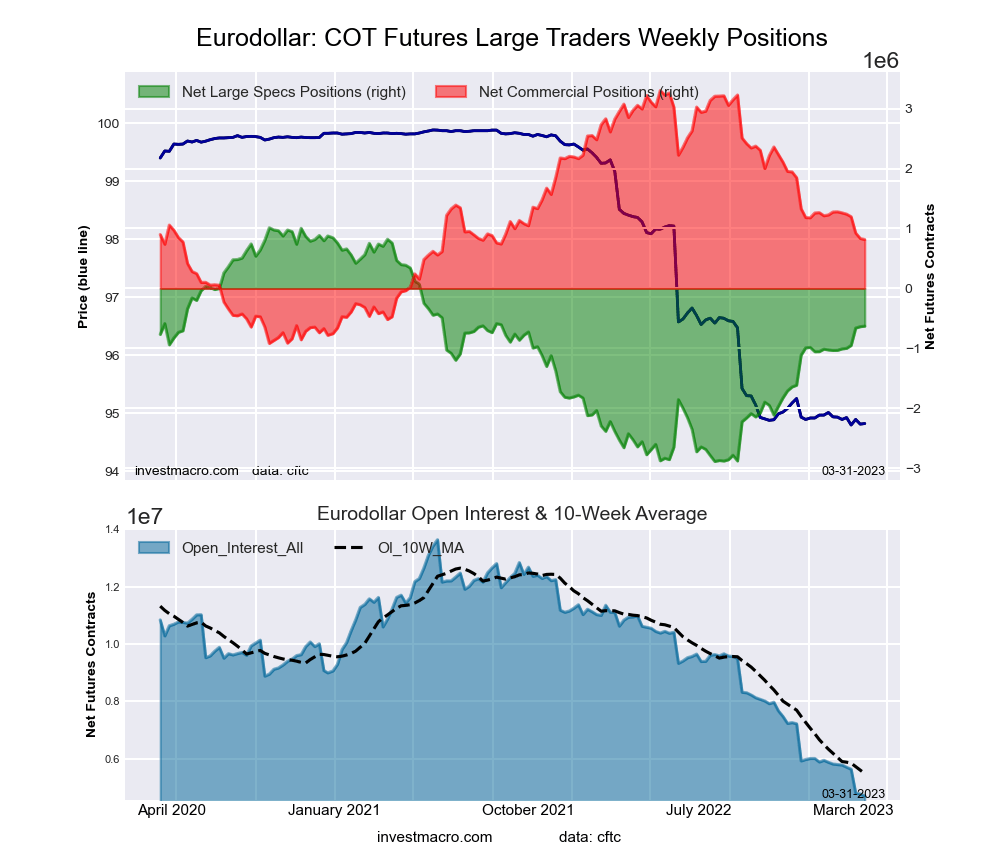
The 3-Month Eurodollars large speculator standing this week was a net position of -629,408 contracts in the data reported through Tuesday. This was a weekly rise of 8,563 contracts from the previous week which had a total of -637,971 net contracts.
This week’s current strength score (the trader positioning range over the past three years, measured from 0 to 100) shows the speculators are currently Bullish with a score of 57.9 percent. The commercials are Bearish with a score of 41.1 percent and the small traders (not shown in chart) are Bullish with a score of 63.5 percent.
| 3-Month Eurodollars Statistics | SPECULATORS | COMMERCIALS | SMALL TRADERS |
| – Percent of Open Interest Longs: | 7.1 | 67.2 | 5.1 |
| – Percent of Open Interest Shorts: | 20.4 | 49.9 | 9.0 |
| – Net Position: | -629,408 | 815,499 | -186,091 |
| – Gross Longs: | 332,423 | 3,163,717 | 238,646 |
| – Gross Shorts: | 961,831 | 2,348,218 | 424,737 |
| – Long to Short Ratio: | 0.3 to 1 | 1.3 to 1 | 0.6 to 1 |
| NET POSITION TREND: | |||
| – Strength Index Score (3 Year Range Pct): | 57.9 | 41.1 | 63.5 |
| – Strength Index Reading (3 Year Range): | Bullish | Bearish | Bullish |
| NET POSITION MOVEMENT INDEX: | |||
| – 6-Week Change in Strength Index: | 10.3 | -11.0 | 13.2 |
Secured Overnight Financing Rate (SOFR 3-Month) Futures:
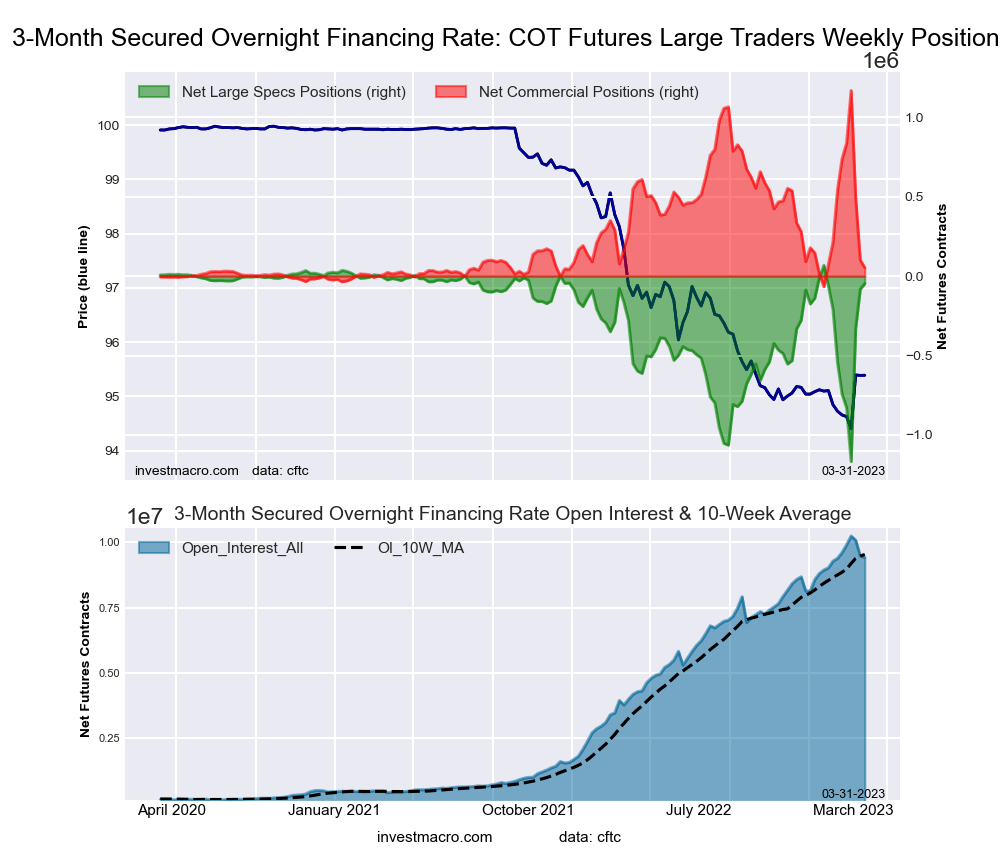
The Secured Overnight Financing Rate (3-Month) large speculator standing this week was a net position of -47,199 contracts in the data reported through Tuesday. This was a weekly gain of 35,598 contracts from the previous week which had a total of -82,797 net contracts.
This week’s current strength score (the trader positioning range over the past three years, measured from 0 to 100) shows the speculators are currently Bullish-Extreme with a score of 90.7 percent. The commercials are Bearish-Extreme with a score of 9.6 percent and the small traders (not shown in chart) are Bullish-Extreme with a score of 84.9 percent.
| SOFR 3-Months Statistics | SPECULATORS | COMMERCIALS | SMALL TRADERS |
| – Percent of Open Interest Longs: | 21.3 | 56.5 | 0.8 |
| – Percent of Open Interest Shorts: | 21.8 | 56.0 | 0.8 |
| – Net Position: | -47,199 | 52,561 | -5,362 |
| – Gross Longs: | 2,001,124 | 5,319,827 | 73,750 |
| – Gross Shorts: | 2,048,323 | 5,267,266 | 79,112 |
| – Long to Short Ratio: | 1.0 to 1 | 1.0 to 1 | 0.9 to 1 |
| NET POSITION TREND: | |||
| – Strength Index Score (3 Year Range Pct): | 90.7 | 9.6 | 84.9 |
| – Strength Index Reading (3 Year Range): | Bullish-Extreme | Bearish-Extreme | Bullish-Extreme |
| NET POSITION MOVEMENT INDEX: | |||
| – 6-Week Change in Strength Index: | 40.2 | -39.6 | -3.5 |
30-Day Federal Funds Futures:
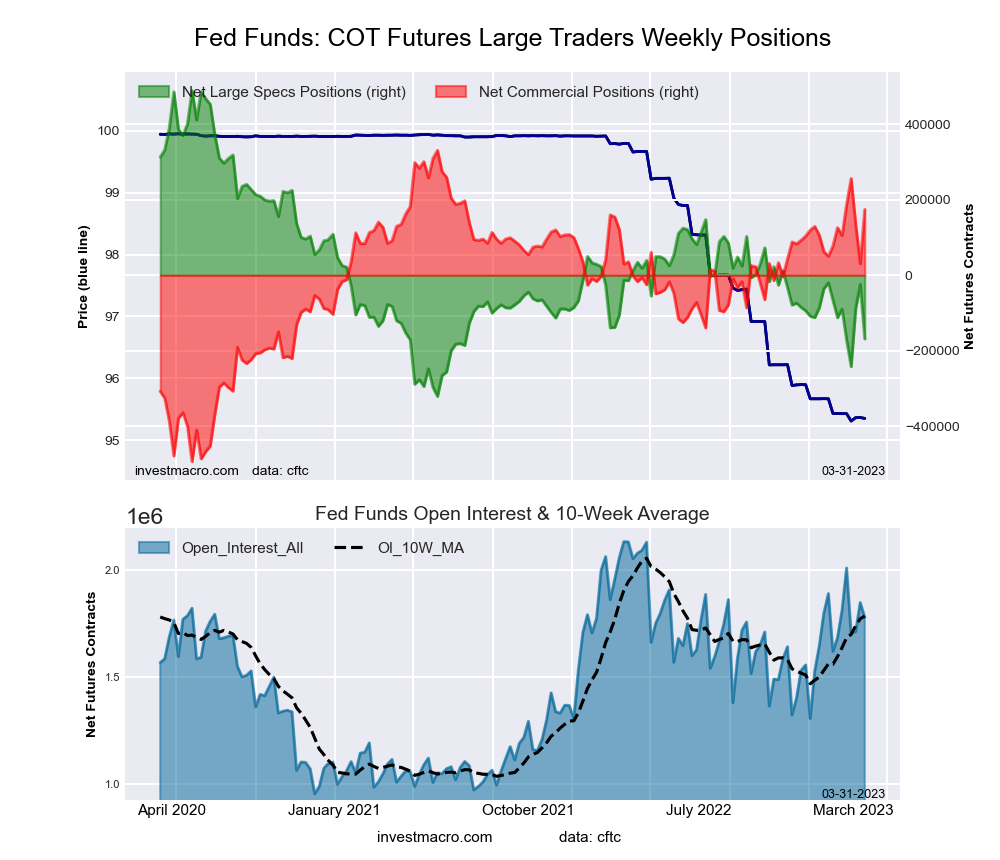
The 30-Day Federal Funds large speculator standing this week was a net position of -168,600 contracts in the data reported through Tuesday. This was a weekly fall of -144,248 contracts from the previous week which had a total of -24,352 net contracts.
This week’s current strength score (the trader positioning range over the past three years, measured from 0 to 100) shows the speculators are currently Bearish-Extreme with a score of 18.8 percent. The commercials are Bullish-Extreme with a score of 81.0 percent and the small traders (not shown in chart) are Bullish-Extreme with a score of 80.3 percent.
| 30-Day Federal Funds Statistics | SPECULATORS | COMMERCIALS | SMALL TRADERS |
| – Percent of Open Interest Longs: | 3.5 | 81.7 | 1.9 |
| – Percent of Open Interest Shorts: | 13.0 | 71.9 | 2.2 |
| – Net Position: | -168,600 | 174,033 | -5,433 |
| – Gross Longs: | 62,664 | 1,454,315 | 33,575 |
| – Gross Shorts: | 231,264 | 1,280,282 | 39,008 |
| – Long to Short Ratio: | 0.3 to 1 | 1.1 to 1 | 0.9 to 1 |
| NET POSITION TREND: | |||
| – Strength Index Score (3 Year Range Pct): | 18.8 | 81.0 | 80.3 |
| – Strength Index Reading (3 Year Range): | Bearish-Extreme | Bullish-Extreme | Bullish-Extreme |
| NET POSITION MOVEMENT INDEX: | |||
| – 6-Week Change in Strength Index: | -6.9 | 5.9 | 15.6 |
2-Year Treasury Note Futures:
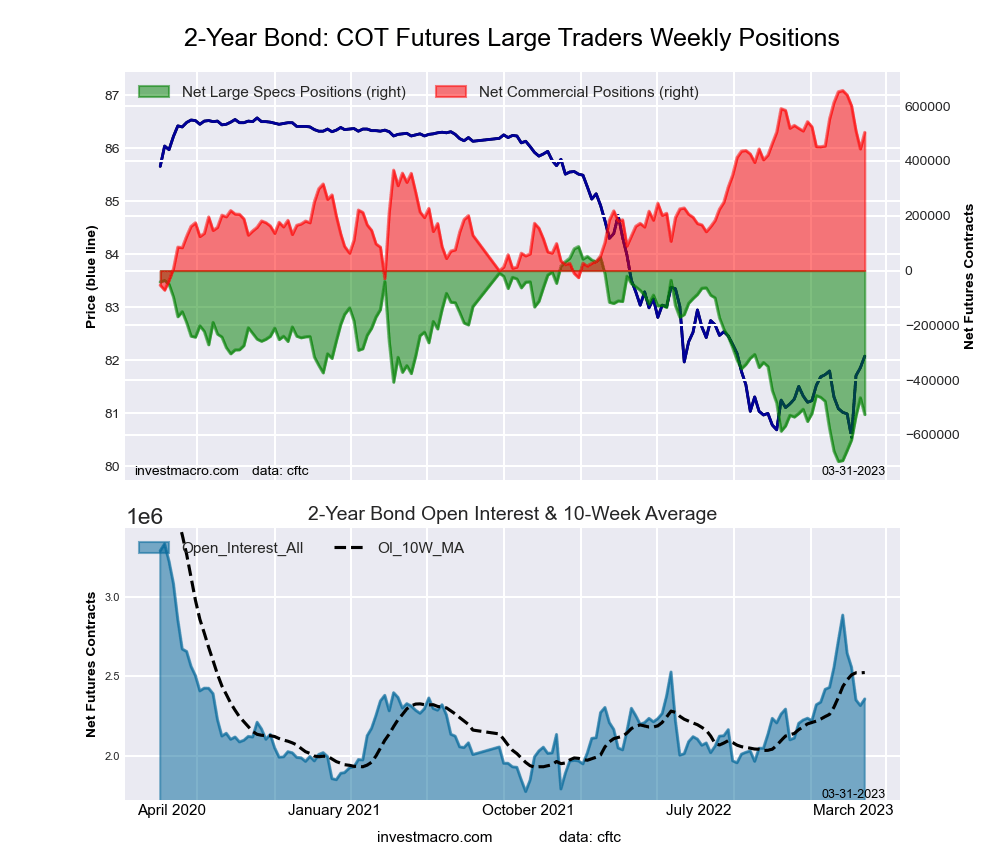
The 2-Year Treasury Note large speculator standing this week was a net position of -525,477 contracts in the data reported through Tuesday. This was a weekly reduction of -61,280 contracts from the previous week which had a total of -464,197 net contracts.
This week’s current strength score (the trader positioning range over the past three years, measured from 0 to 100) shows the speculators are currently Bearish with a score of 21.8 percent. The commercials are Bullish with a score of 78.3 percent and the small traders (not shown in chart) are Bullish with a score of 65.9 percent.
| 2-Year Treasury Note Statistics | SPECULATORS | COMMERCIALS | SMALL TRADERS |
| – Percent of Open Interest Longs: | 5.7 | 85.2 | 8.3 |
| – Percent of Open Interest Shorts: | 28.0 | 63.8 | 7.4 |
| – Net Position: | -525,477 | 504,395 | 21,082 |
| – Gross Longs: | 133,376 | 2,007,134 | 196,052 |
| – Gross Shorts: | 658,853 | 1,502,739 | 174,970 |
| – Long to Short Ratio: | 0.2 to 1 | 1.3 to 1 | 1.1 to 1 |
| NET POSITION TREND: | |||
| – Strength Index Score (3 Year Range Pct): | 21.8 | 78.3 | 65.9 |
| – Strength Index Reading (3 Year Range): | Bearish | Bullish | Bullish |
| NET POSITION MOVEMENT INDEX: | |||
| – 6-Week Change in Strength Index: | 21.8 | -21.1 | -10.9 |
5-Year Treasury Note Futures:
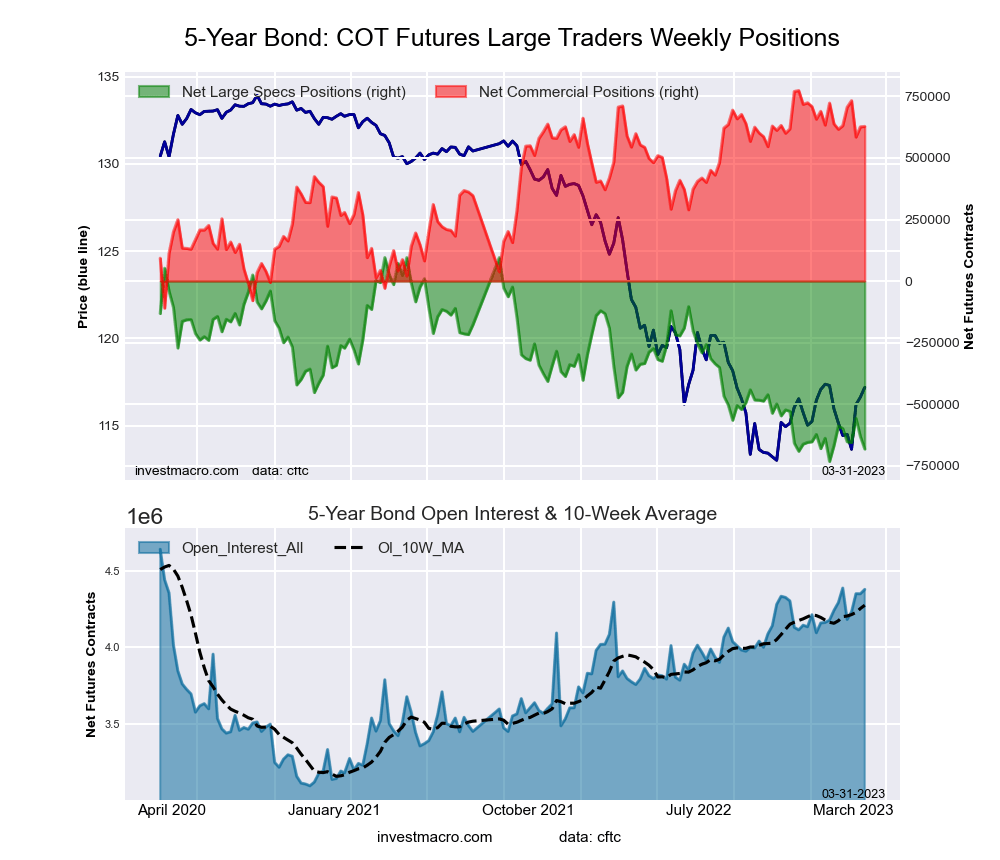
The 5-Year Treasury Note large speculator standing this week was a net position of -682,355 contracts in the data reported through Tuesday. This was a weekly reduction of -50,787 contracts from the previous week which had a total of -631,568 net contracts.
This week’s current strength score (the trader positioning range over the past three years, measured from 0 to 100) shows the speculators are currently Bearish-Extreme with a score of 6.1 percent. The commercials are Bullish-Extreme with a score of 82.9 percent and the small traders (not shown in chart) are Bullish-Extreme with a score of 95.9 percent.
| 5-Year Treasury Note Statistics | SPECULATORS | COMMERCIALS | SMALL TRADERS |
| – Percent of Open Interest Longs: | 7.8 | 82.5 | 8.6 |
| – Percent of Open Interest Shorts: | 23.4 | 68.1 | 7.4 |
| – Net Position: | -682,355 | 628,178 | 54,177 |
| – Gross Longs: | 343,241 | 3,611,307 | 377,097 |
| – Gross Shorts: | 1,025,596 | 2,983,129 | 322,920 |
| – Long to Short Ratio: | 0.3 to 1 | 1.2 to 1 | 1.2 to 1 |
| NET POSITION TREND: | |||
| – Strength Index Score (3 Year Range Pct): | 6.1 | 82.9 | 95.9 |
| – Strength Index Reading (3 Year Range): | Bearish-Extreme | Bullish-Extreme | Bullish-Extreme |
| NET POSITION MOVEMENT INDEX: | |||
| – 6-Week Change in Strength Index: | -11.2 | 1.4 | 22.3 |
10-Year Treasury Note Futures:
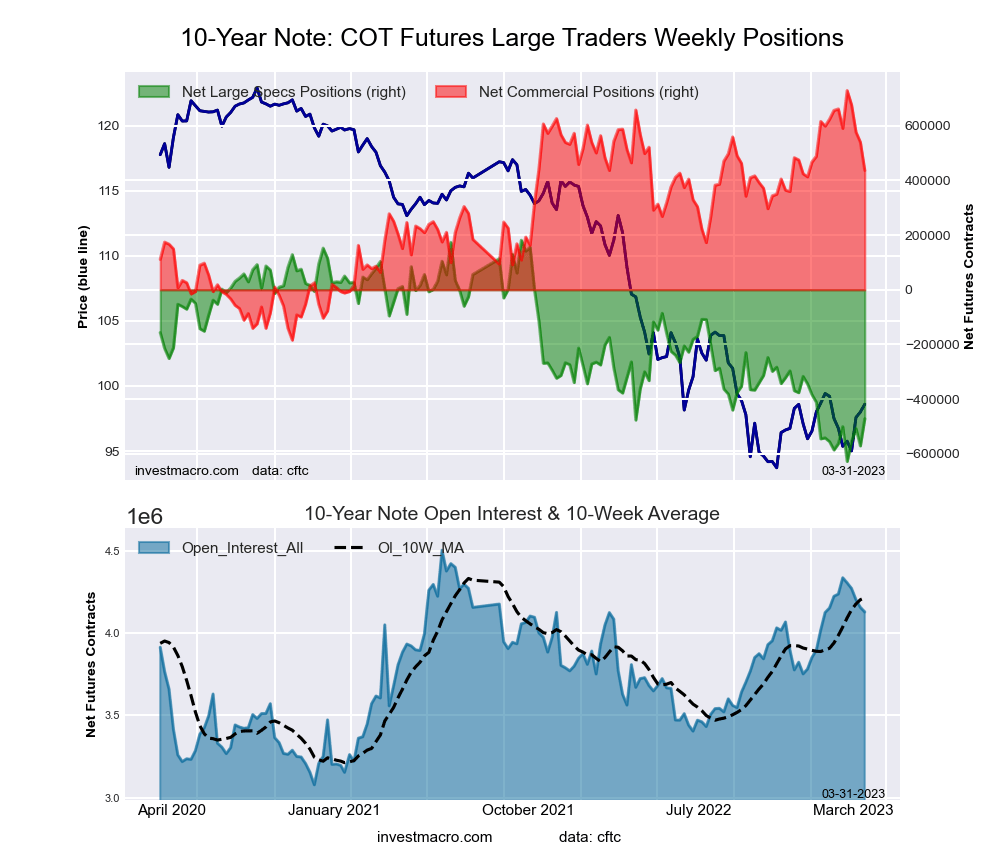
The 10-Year Treasury Note large speculator standing this week was a net position of -471,578 contracts in the data reported through Tuesday. This was a weekly rise of 99,451 contracts from the previous week which had a total of -571,029 net contracts.
This week’s current strength score (the trader positioning range over the past three years, measured from 0 to 100) shows the speculators are currently Bearish-Extreme with a score of 19.3 percent. The commercials are Bullish with a score of 68.0 percent and the small traders (not shown in chart) are Bullish-Extreme with a score of 92.0 percent.
| 10-Year Treasury Note Statistics | SPECULATORS | COMMERCIALS | SMALL TRADERS |
| – Percent of Open Interest Longs: | 10.4 | 78.6 | 9.2 |
| – Percent of Open Interest Shorts: | 21.9 | 68.0 | 8.3 |
| – Net Position: | -471,578 | 436,497 | 35,081 |
| – Gross Longs: | 430,598 | 3,245,247 | 379,666 |
| – Gross Shorts: | 902,176 | 2,808,750 | 344,585 |
| – Long to Short Ratio: | 0.5 to 1 | 1.2 to 1 | 1.1 to 1 |
| NET POSITION TREND: | |||
| – Strength Index Score (3 Year Range Pct): | 19.3 | 68.0 | 92.0 |
| – Strength Index Reading (3 Year Range): | Bearish-Extreme | Bullish | Bullish-Extreme |
| NET POSITION MOVEMENT INDEX: | |||
| – 6-Week Change in Strength Index: | 11.3 | -24.6 | 33.0 |
Ultra 10-Year Notes Futures:

The Ultra 10-Year Notes large speculator standing this week was a net position of -151,804 contracts in the data reported through Tuesday. This was a weekly advance of 6,322 contracts from the previous week which had a total of -158,126 net contracts.
This week’s current strength score (the trader positioning range over the past three years, measured from 0 to 100) shows the speculators are currently Bearish-Extreme with a score of 10.6 percent. The commercials are Bullish-Extreme with a score of 84.0 percent and the small traders (not shown in chart) are Bullish with a score of 66.1 percent.
| Ultra 10-Year Notes Statistics | SPECULATORS | COMMERCIALS | SMALL TRADERS |
| – Percent of Open Interest Longs: | 8.8 | 79.1 | 10.9 |
| – Percent of Open Interest Shorts: | 18.5 | 64.2 | 16.1 |
| – Net Position: | -151,804 | 232,397 | -80,593 |
| – Gross Longs: | 136,441 | 1,232,587 | 170,563 |
| – Gross Shorts: | 288,245 | 1,000,190 | 251,156 |
| – Long to Short Ratio: | 0.5 to 1 | 1.2 to 1 | 0.7 to 1 |
| NET POSITION TREND: | |||
| – Strength Index Score (3 Year Range Pct): | 10.6 | 84.0 | 66.1 |
| – Strength Index Reading (3 Year Range): | Bearish-Extreme | Bullish-Extreme | Bullish |
| NET POSITION MOVEMENT INDEX: | |||
| – 6-Week Change in Strength Index: | -6.4 | 2.2 | 12.0 |
US Treasury Bonds Futures:
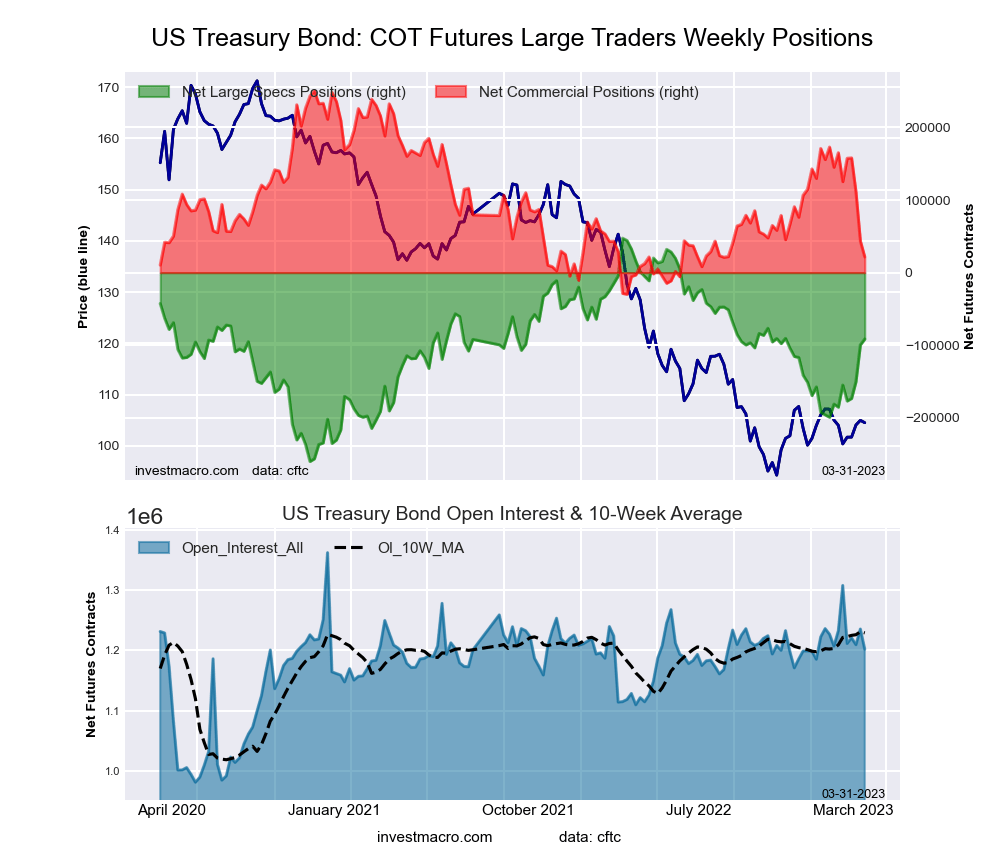
The US Treasury Bonds large speculator standing this week was a net position of -91,399 contracts in the data reported through Tuesday. This was a weekly boost of 8,014 contracts from the previous week which had a total of -99,413 net contracts.
This week’s current strength score (the trader positioning range over the past three years, measured from 0 to 100) shows the speculators are currently Bullish with a score of 54.8 percent. The commercials are Bearish-Extreme with a score of 18.3 percent and the small traders (not shown in chart) are Bullish-Extreme with a score of 100.0 percent.
| US Treasury Bonds Statistics | SPECULATORS | COMMERCIALS | SMALL TRADERS |
| – Percent of Open Interest Longs: | 8.8 | 76.6 | 14.4 |
| – Percent of Open Interest Shorts: | 16.4 | 74.8 | 8.6 |
| – Net Position: | -91,399 | 21,686 | 69,713 |
| – Gross Longs: | 105,219 | 920,469 | 172,685 |
| – Gross Shorts: | 196,618 | 898,783 | 102,972 |
| – Long to Short Ratio: | 0.5 to 1 | 1.0 to 1 | 1.7 to 1 |
| NET POSITION TREND: | |||
| – Strength Index Score (3 Year Range Pct): | 54.8 | 18.3 | 100.0 |
| – Strength Index Reading (3 Year Range): | Bullish | Bearish-Extreme | Bullish-Extreme |
| NET POSITION MOVEMENT INDEX: | |||
| – 6-Week Change in Strength Index: | 30.5 | -51.1 | 36.5 |
Ultra US Treasury Bonds Futures:
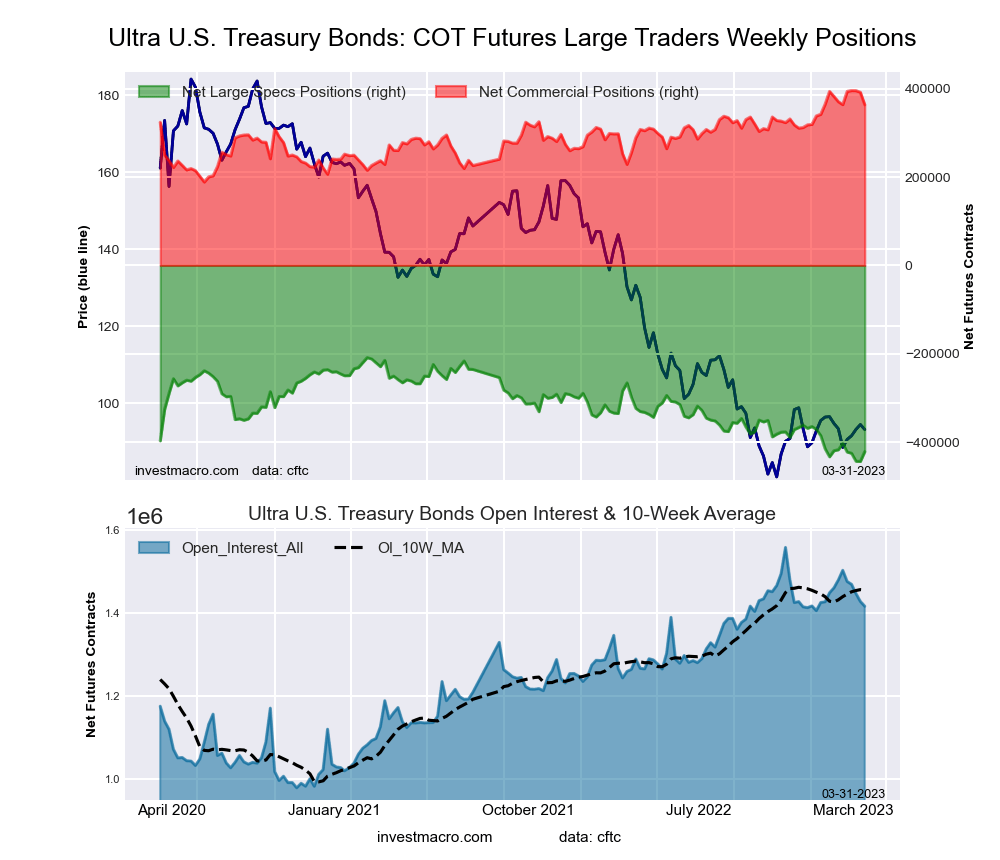
The Ultra US Treasury Bonds large speculator standing this week was a net position of -421,776 contracts in the data reported through Tuesday. This was a weekly rise of 22,186 contracts from the previous week which had a total of -443,962 net contracts.
This week’s current strength score (the trader positioning range over the past three years, measured from 0 to 100) shows the speculators are currently Bearish-Extreme with a score of 9.4 percent. The commercials are Bullish-Extreme with a score of 84.5 percent and the small traders (not shown in chart) are Bullish-Extreme with a score of 97.9 percent.
| Ultra US Treasury Bonds Statistics | SPECULATORS | COMMERCIALS | SMALL TRADERS |
| – Percent of Open Interest Longs: | 4.8 | 83.0 | 12.0 |
| – Percent of Open Interest Shorts: | 34.6 | 57.4 | 7.9 |
| – Net Position: | -421,776 | 363,697 | 58,079 |
| – Gross Longs: | 68,540 | 1,175,863 | 170,261 |
| – Gross Shorts: | 490,316 | 812,166 | 112,182 |
| – Long to Short Ratio: | 0.1 to 1 | 1.4 to 1 | 1.5 to 1 |
| NET POSITION TREND: | |||
| – Strength Index Score (3 Year Range Pct): | 9.4 | 84.5 | 97.9 |
| – Strength Index Reading (3 Year Range): | Bearish-Extreme | Bullish-Extreme | Bullish-Extreme |
| NET POSITION MOVEMENT INDEX: | |||
| – 6-Week Change in Strength Index: | -1.9 | -3.3 | 11.3 |
*COT Report: The COT data, released weekly to the public each Friday, is updated through the most recent Tuesday (data is 3 days old) and shows a quick view of how large speculators or non-commercials (for-profit traders) were positioned in the futures markets.
The CFTC categorizes trader positions according to commercial hedgers (traders who use futures contracts for hedging as part of the business), non-commercials (large traders who speculate to realize trading profits) and nonreportable traders (usually small traders/speculators) as well as their open interest (contracts open in the market at time of reporting). See CFTC criteria here.
More By This Author:
Large Speculators Have Dropped Their Corn Bullish Bets To Near 130-Week Lows
Currency Speculators Drop Their Canadian Dollar Bets Fall To 218-Week Low
COT Bonds Speculators Boosting 2-Year Bond Bets After Record Low


Comments
Log in or sign up to join the conversation.