

Image source: Pixabay
I am hardly a Shakespeare afficionado, but many with just a passing knowledge of the Bard’s work are familiar with the soothsayer’s admonition in “Julius Caesar”: “Beware the Ides of March.”It forebodes Caesar’s actual assassination on March 15th, 44 BCE.Recent market history – the peak of the internet bubble and the Covid crash — and a looming government shutdown deadline continue to make that apocryphal phrase relevant.
As of this writing, there is a distinct possibility that the US government could run out of funding by the end of the day on Friday, March 14th, meaning that the government could shut down on the 15th – the Ides of March.As of now, there is still a general belief that a shutdown could be averted – they usually are – but the fractious political environment could make this a more challenging negotiation than usual.
Helpfully, you can track the odds – and assert your own estimates – using IBKR’s Forecast Trader.The current probability for a shutdown is 44%.It dipped overnight, when traders apparently factored in the negotiations that appear to have House Republicans united around a plan to advance a funding bill, but that still needs to pass through a procedural vote today and a floor vote tomorrow.Even if those hurdles are met, the bill would need to find a filibuster-proof majority in the Senate before it reaches the President’s desk.It is understandable why a fair degree of uncertainty is attached to its prospects.
(Click on image to enlarge)
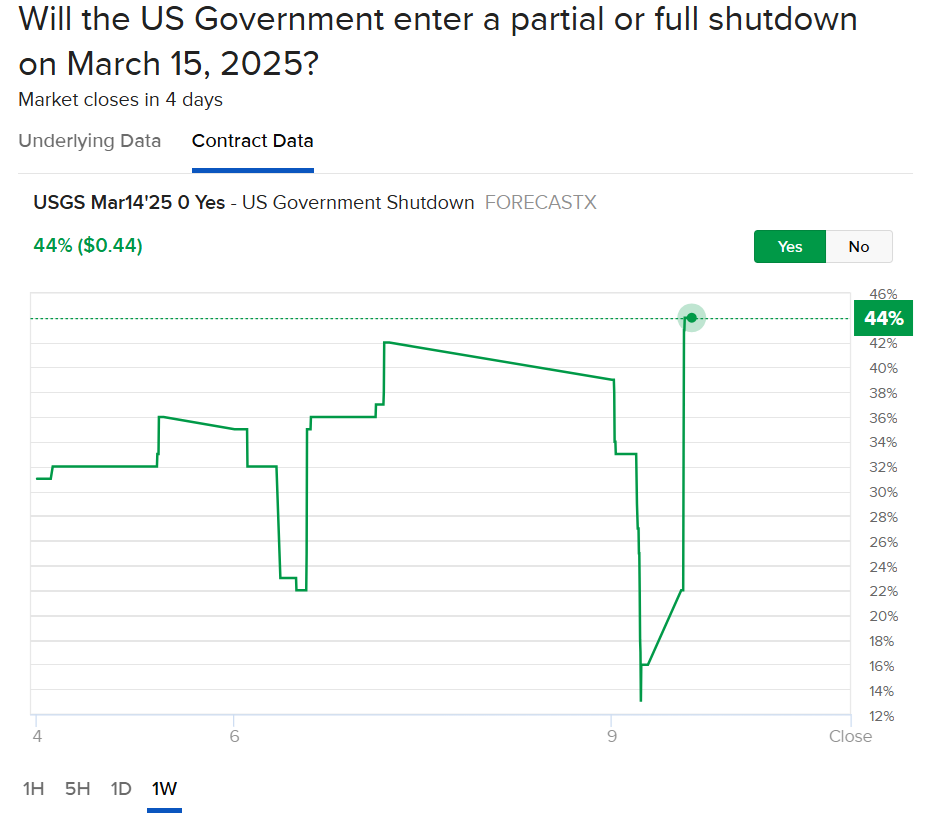
Source: Interactive Brokers ForecastEx
The political peregrinations are best left to pundits of a different stripe, but the market implications of a shutdown are not great.Equity markets are already reeling from concerns that budgetary cutbacks and tariff concerns have proven to be bigger early priorities for the new administration than the easier regulatory climate and tax cuts that were initially priced in.Markets don’t enjoy uncertainty, and both aforementioned priorities have none nothing to quell concerned investors.
In markets, uncertainty is reflected as volatility, and the most popular measure of that is the Cboe Volatility Index (VIX).VIX continues to trade at relatively elevated levels, and while it is tempting to assert that VIX is now reflecting investors’ fear, a more rational explanation is rooted in both perceptions about potential moves over the coming month and high levels of correlations.
Remember our opinion that “VIX is not a fear gauge, it just plays one on TV.”Heck, I even said that on TV on Thursday.Remember, VIX is constructed to measure the market’s best estimate of S&P 500 (SPX) volatility over the coming 30 days, not sentiment.Of course, there is a well-known relationship between nervous markets and higher VIX, but once markets become volatile traders often expect that volatility to persist. In a week that includes CPI and PPI reports as well as shutdown drama and stagflationary concerns, is it wrong for the traders to price in roughly 1.5% daily moves over the coming days?[i]Also, when market correlations, as measured by the Cboe’s COR1M index, are at currently elevated levels, we also see elevated VIX.
1-Year Chart, VIX (red/green daily candles), COR1M (blue line)
(Click on image to enlarge)
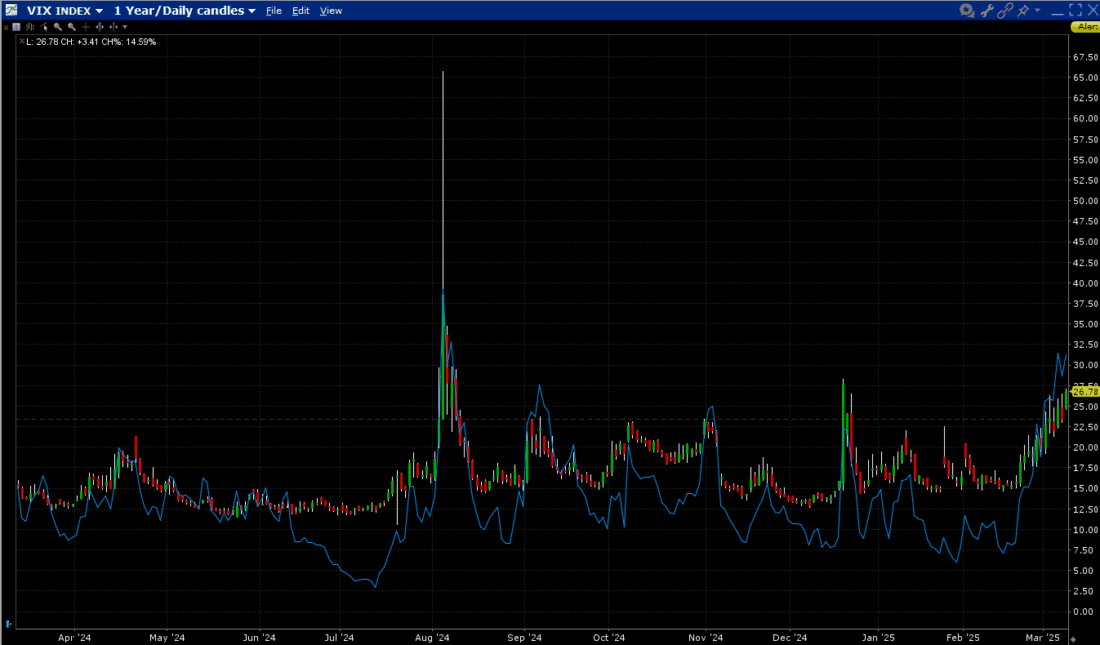
Source: Interactive Brokers
Now, a quick word about eerie historical precedents.During the late ‘90’s-2000 internet bubble, SPX’s peak closing high was on March 14th, 2000. It was a Friday, so that counts as the Ides of March from a market viewpoint.To be fair, the Nasdaq 100 (NDX) was the main recipient of the frenzy, and its closing high was not reached for another 13 days.But I’ll assert that March 27th is not too far outside the “Ides of March” realm.
1998-2001, SPX (white, right scale), NDX (blue, left scale)
(Click on image to enlarge)
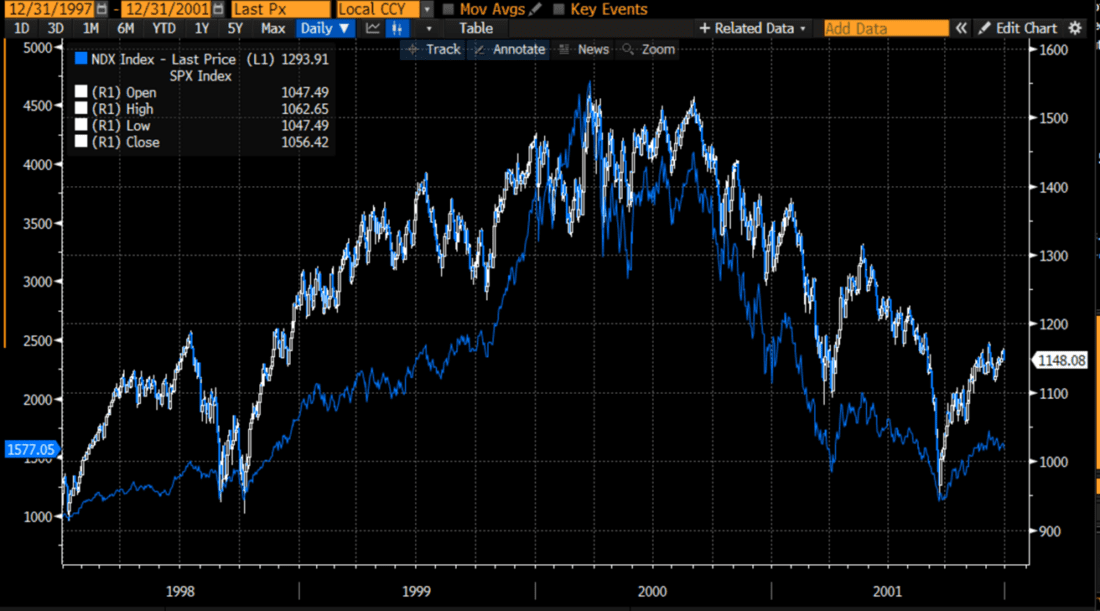
Source: Bloomberg
On a more positive note, the massive Covid selloff culminated during late March 2020.The closing low for NDX was on Friday, March 20, 2020, and the closing low for SPX followed on Monday the 23rd.Unfortunately, while we were closed on the 15th of that year, the 16th was truly ugly, with SPX and NDX each diving about -13% that day.Beware the Ides of March indeed!
July 2019-June 2020, SPX (white, right scale), NDX (blue, left scale)
(Click on image to enlarge)
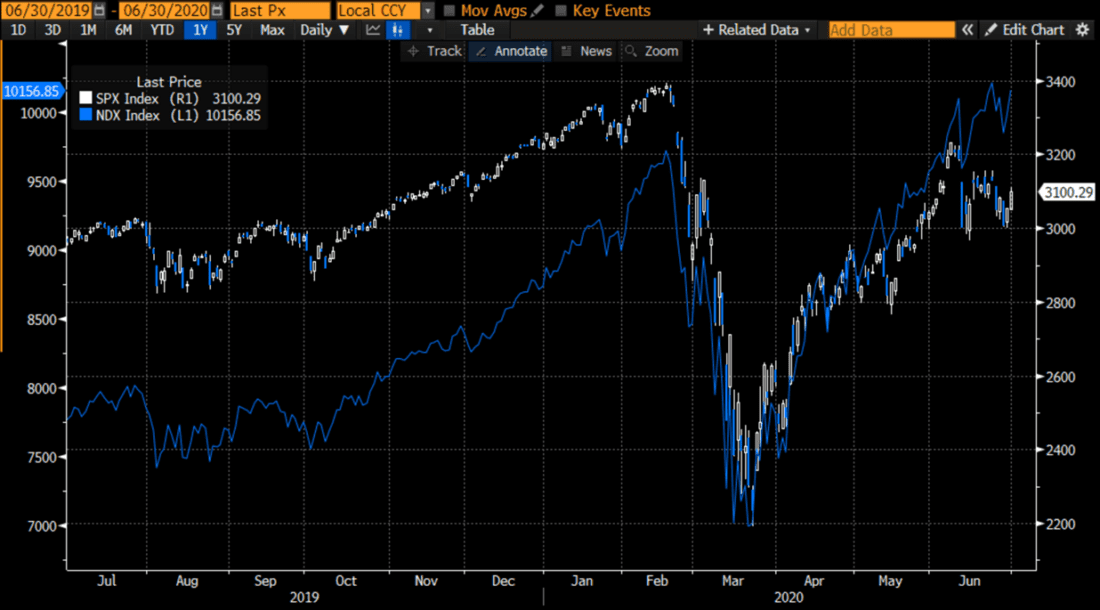
Source: Bloomberg
[1] Remember the “Rule of 16”.Even though VIX is expressed in terms of annualized volatility, it is more useful for short-term traders to think in daily volatility terms.In general, that conversion is done by dividing the annualized number by the square root of business days in a year, which is conveniently close to 16.Although the VIX computation makes it an imperfect comparison, it is fair to say that a 24 VIX is roughly equivalent to 1.5% daily volatility.
More By This Author:
“Dump And Chase” Works In Hockey, Not In Markets
Investors Look Abroad On Tariff Eve
Sixty Percent Of The Time, It Works Every Time


Comments
Log in or sign up to join the conversation.