
By now, you probably know that the market is currently in the early stages of what historically has been the weakest three-month period of the year for the S&P 500. Even in the weakest of periods, though, not every stock usually goes down. In what has historically been a weak period of time for the S&P 500, we screened our Seasonality Database for S&P 500 stocks that have historically performed the best from the close on 8/4 through the end of August.
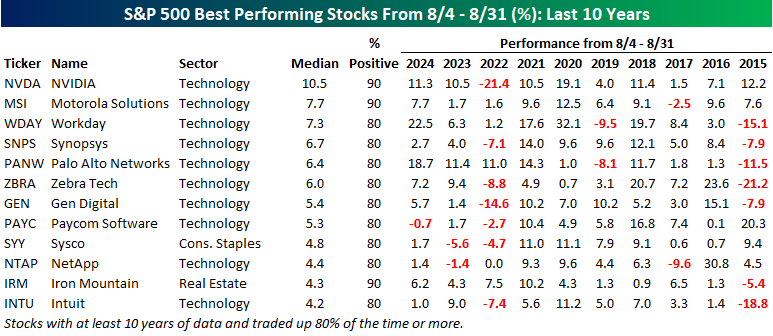
The table below lists the dozen S&P 500 stocks that have experienced a median gain of at least 4% and traded higher at least 80% of the time from the close on 8/4 through 8/31. Topping the list, NVIDIA's (NVDA) gain during this period has been 10.5% with gains 90% of the time. NVDA has become the face of AI since Chat GPT's 2022 launch, but from 2015 through 2021, it also traded higher during this period each year. Along with NVDA, the only other stocks in the table that traded higher 90% of the time were Motorola Solutions (MSI) and Iton Mountain (IRM). What also stands out about the names on the table is that all but two of them are from the Technology sector.
(Click on image to enlarge)
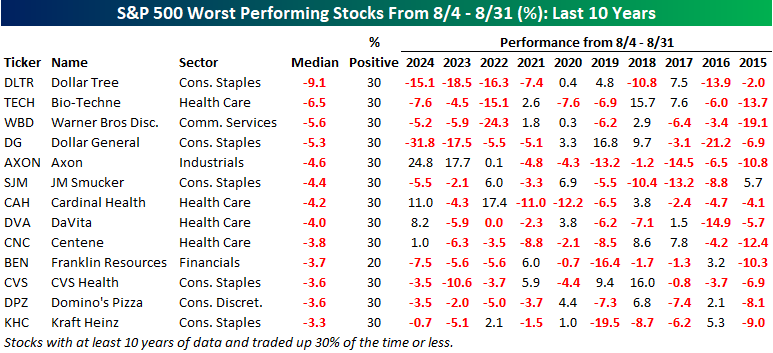
On the downside, the table below lists the thirteen stocks in the S&P 500 that have had a median decline of at least 3% from the 8/4 close through month-end, with gains 30% of the time or less. Topping the list of losers is Dollar Tree (DLTR) with a median decline of 9.1% and gains just 30% of the time. This has been an especially weak time of year for the stock over the last four years, as it has declined at least 7.4% each time. Axon (AXON) is another notable name on the list. Even with a median decline of 4.6%, it has been up during this period for three straight years with gains of 0.1%, 17.7%, and 24.8%, respectively. Unlike the list of winners, which was almost entirely Technology sectors, the list of losers is much more diverse, with six sectors represented, even as five are in the Consumer Staples sector.
(Click on image to enlarge)
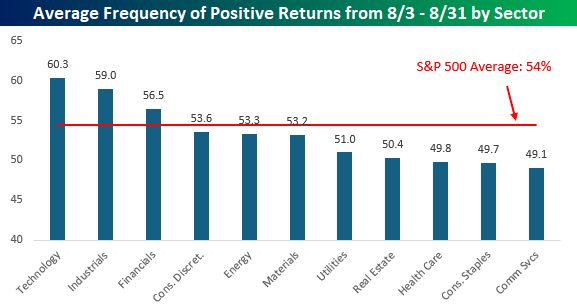
Just about all of the stocks listed on the table of best performing stocks from the close on 8/4 through month-end are from the Technology sector, and the chart below further illustrates the strength of the sector during this period. As shown, stocks in the sector have traded higher an average of 60.3% of the time from 8/4 through 8/31. Not far behind, stocks in the Industrials sector have traded higher an average of 59% of the time, followed by Financials with gains 56.5% of the time. These three sectors are also the only ones that have had a higher winning percentage than the S&P 500. To the downside, the only three sectors that have traded higher during this period less than half of the time are Communication Services, Consumer Staples, and Health Care.
More By This Author:
Jobs Day In Four ChartsKey ETF Asset Class Performance
The Carvana Comeback


Comments
Log in or sign up to join the conversation.