

Or, a post for Steven Kopits.
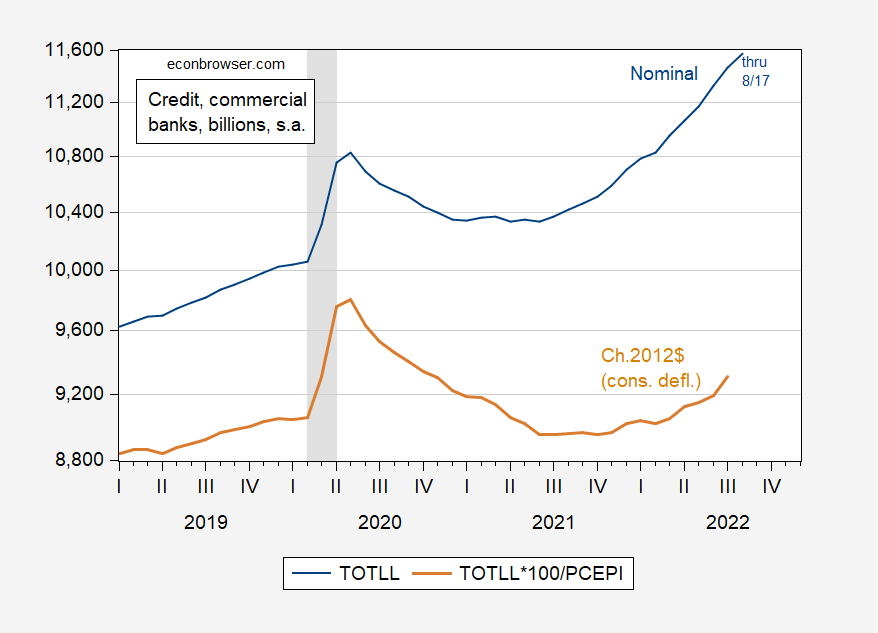
Figure 1: Loans and Leases in Bank Credit, All Commercial Banks, in billions $, s.a. (blue), and in billions Ch.2012$, s.a. (tan), both on log scale. Real series PCE price index deflated. NBER defined peak-to-recession dates shaded gray. Source: Federal Reserve via FRED, series TOTLL, BEA via FRED, NBER, and author’s calculations.
In the run-up to the 2007 recession, nominal and real lending growth were decreasing. As of July (for real) and August 17 (for nominal), growth rates are rising. (Note that because I have plotted both series on a log scale, an increasing slope denotes a rising growth rate; this is an attribute of logs that Jim Hamilton has highlighted in the past).
I welcome any cogent arguments, based on data, for why we should consider ourselves in August (or in H1) in a recession, from the usual suspects.
More By This Author:
GDP, GDO, GDP+, Hours And IncomeWeekly Economic Activity Measures For The Week Ending Aug. 20
Nonfarm Payroll Employment And Implications Of The Preliminary Benchmark Revision


Comments
Log in or sign up to join the conversation.