

Image Source: Unsplash
The AUD/USD briefly touched multi-month highs just below 0.6900 in early Thursday trading before settling back to cycle near 0.6850 as markets churn in the second-last trading day of 2023, with US Dollar flows setting the tone for the broader market.
Money markets continue to pin their hopes and dreams on an accelerated pace of rate cuts from the Federal Reserve (Fed) in 2024, with investors betting on rate cuts to start as soon as March and pegging upwards of 160 basis points in rate cuts through the end of next year.
With markets leaning into expectations of a major policy shift from the Fed in the coming months, US data is driving the economic calendar as 2023 draws to a close.
US data driving the market cart as investors await Fed rate cuts
US Initial Jobless Claims missed expectations, printing at 218K for the week ended December 22 versus the forecast 210K, vaulting over the previous week’s print of 206K (revised slightly higher from 205K). US Pending Home Sales in November also missed the mark, printing at a flat 0.0% versus the forecast 1.0% rebound from October’s -1.2% print (revised upwards from -1.5%).
Bad news is good news for money markets, as waffling US data increases the chances that the Fed will get pushed into the next rate-cut cycle sooner rather than later. As recently as a month ago, the Fed was firmly entrenched in a “rates higher for longer” narrative, and the US central bank’s sudden stance shift in December sparked a massive risk rally in the tail-end of 2023. Multiple attempts from Fed officials to splash cold water on hot markets have thus far had little impact with the US Dollar plunging over 3.5% against the Australian Dollar (AUD).
Friday will close out the 2023 trading year with the US Chicago Purchasing Managers’ Index for December, forecast to decline from 55.8 to 51.0.
AUD/USD Technical Outlook
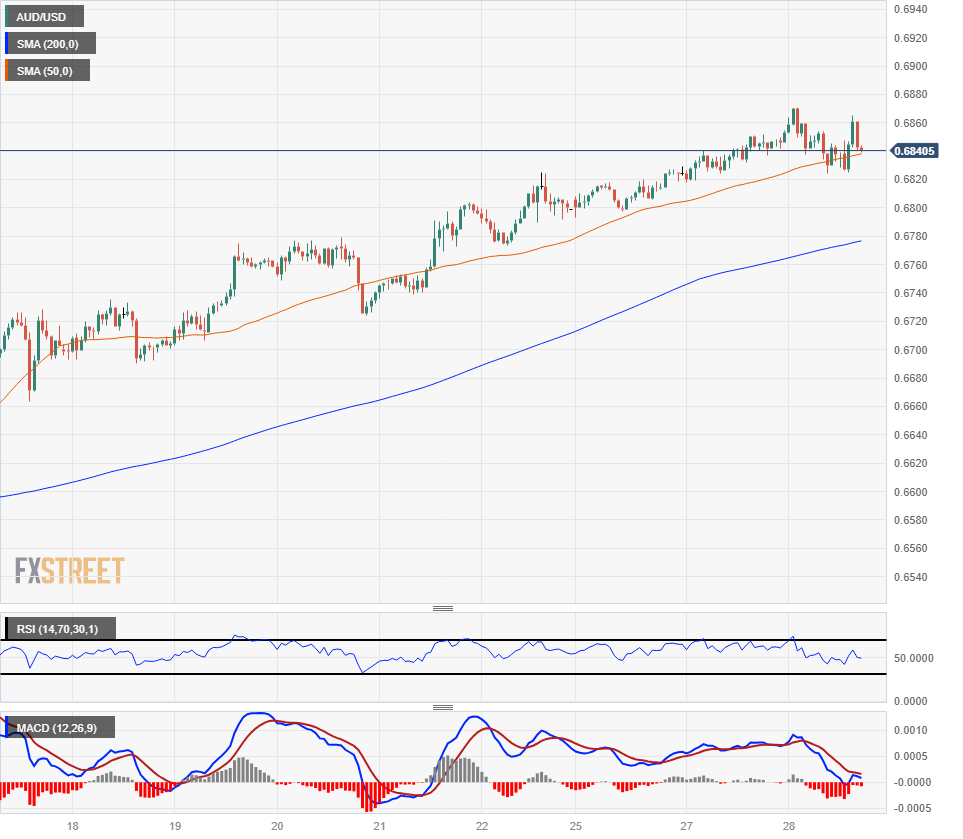
Despite broad-market Greenback weakness, and a fresh multi-month high for the AUD/USD, the Aussie is struggling to take meaningful territory from the US Dollar on Thursday, waffling into the 50-hour Simple Moving Average (SMA) as bullish bids stretch their upper limits.
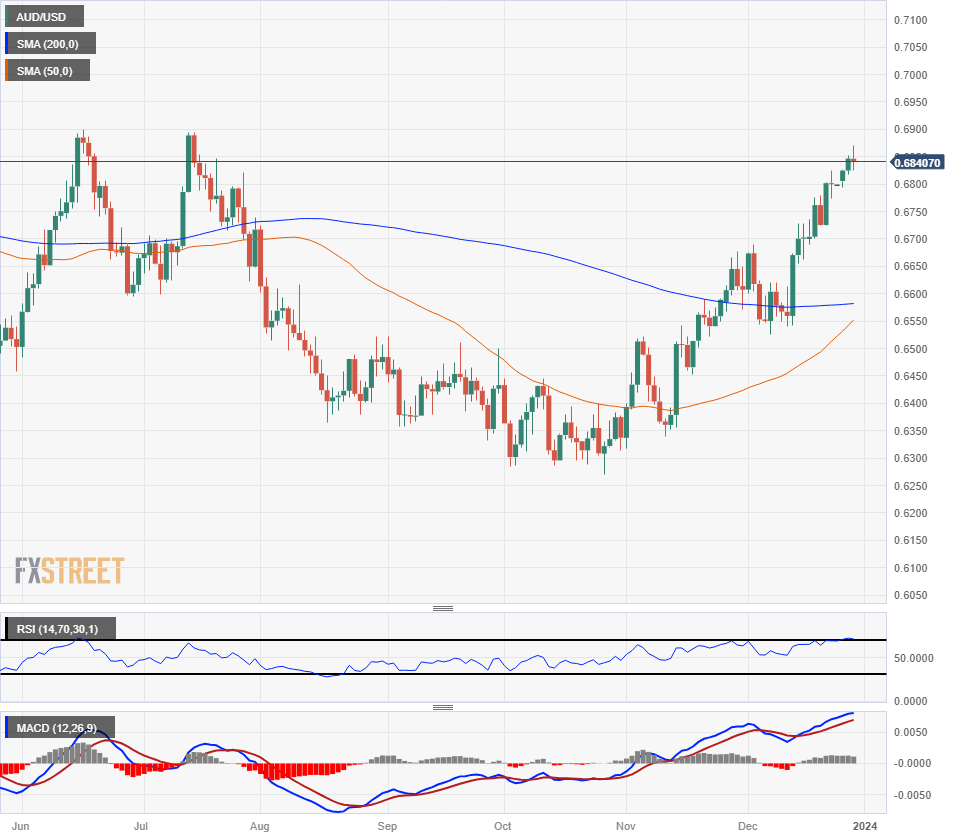
The AUD/USD is set for a third straight week of gains and has gained over 9% from October’s bottom bids near 0.6270, and long-term resistance sits at the 200-day SMA parked just below 0.6600 with the nearest price floor sitting at early December’s previous swing high marked in just below the 0.6700 handle.
AUD/USD Hourly Chart
(Click on image to enlarge)
AUD/USD Daily Chart
(Click on image to enlarge)
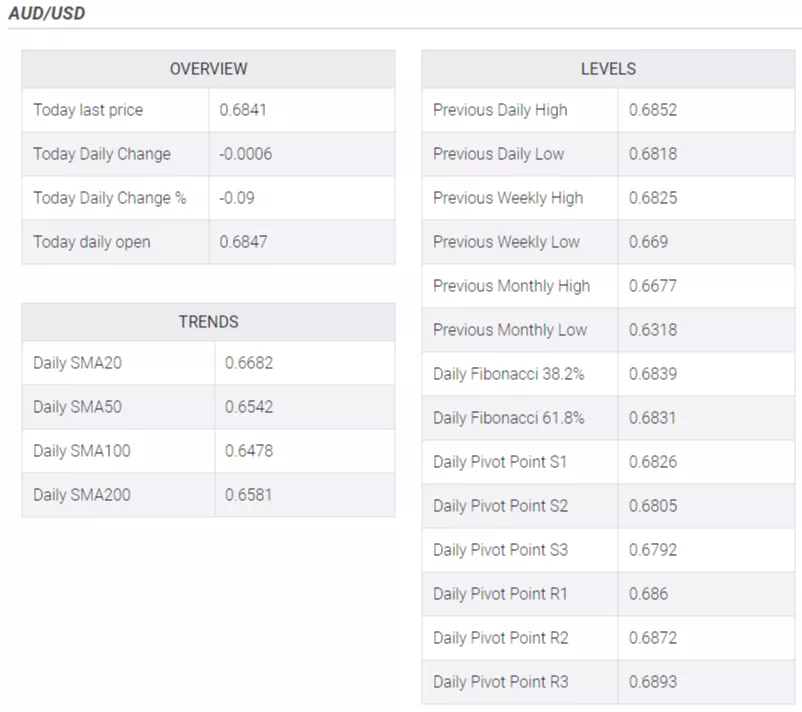
AUD/USD Technical Levels
More By This Author:
USD/CHF Remains Steady Near Multi-Year Lows After US Jobless Claims
USD/JPY Price Analysis: Declines To Five-Month Low, Trades Near 140.80
USD/CAD Hovers Around 1.3200 Ahead Of US Jobless Claims


Comments
Log in or sign up to join the conversation.