USD/JPY Price Analysis: Declines To Five-Month Low, Trades Near 140.80
- USD/JPY moves below the 141.00 psychological level on the back of the subdued US Dollar.
- A firm break above the 142.00 level could lead the pair to reach a nine-day EMA at 142.41.
- Technical indicators suggest a bearish sentiment to test the major support at 140.50.
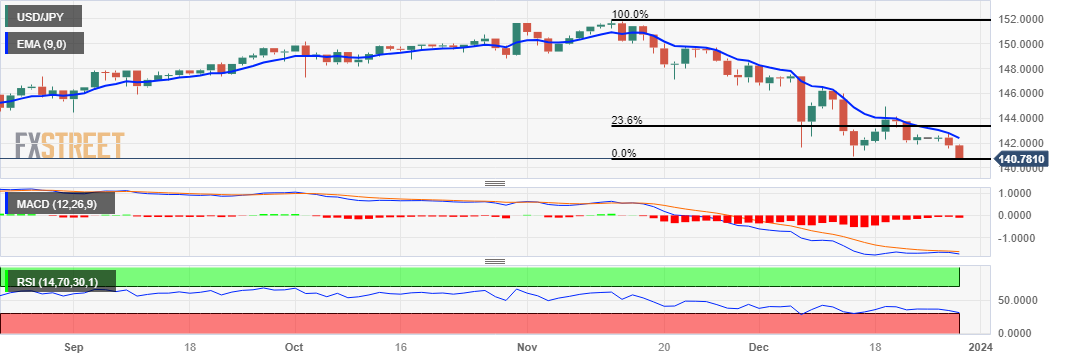
USD/JPY extends its losses as the US Dollar (USD) weakens on the back of the dovish Federal Reserve’s (Fed) outlook in the first quarter of 2024. The USD/JPY pair trades lower around 140.80 during the early European session on Thursday. The 141.00 psychological level emerges as the immediate resistance following the next barrier at the 142.00 level.
if there is a breakthrough above the psychological level, it may support the USD/JPY pair to reach the nine-day Exponential Moving Average (EMA) at 142.41, following the psychological resistance at the 143.00 level. If the pair successfully surpasses this level, the next barrier would be the 23.6% Fibonacci retracement level at 143.35.
The 14-day Relative Strength Index (RSI) below the 50 level indicates a weaker sentiment for the USD/JPY pair. Additionally, the Moving Average Convergence Divergence (MACD) line is positioned below the centerline and the signal line, signaling a bearish momentum in the market for the USD/JPY pair.
The bearish sentiment could potentially lead the USD/JPY pair towards the major support region around 140.50. If there is a decisive break below this level, it may open the door for the pair to test the psychological level at 140.00.
USD/JPY: Daily Chart
(Click on image to enlarge)
USD/JPY: Additional Technical Levels To Watch
| OVERVIEW | |
|---|---|
| Today last price | 140.82 |
| Today Daily Change | -0.99 |
| Today Daily Change % | -0.70 |
| Today daily open | 141.81 |
| TRENDS | |
|---|---|
| Daily SMA20 | 144.32 |
| Daily SMA50 | 147.69 |
| Daily SMA100 | 147.63 |
| Daily SMA200 | 142.93 |
| LEVELS | |
|---|---|
| Previous Daily High | 142.85 |
| Previous Daily Low | 141.55 |
| Previous Weekly High | 144.96 |
| Previous Weekly Low | 141.86 |
| Previous Monthly High | 151.91 |
| Previous Monthly Low | 146.67 |
| Daily Fibonacci 38.2% | 142.05 |
| Daily Fibonacci 61.8% | 142.35 |
| Daily Pivot Point S1 | 141.29 |
| Daily Pivot Point S2 | 140.77 |
| Daily Pivot Point S3 | 139.99 |
| Daily Pivot Point R1 | 142.59 |
| Daily Pivot Point R2 | 143.37 |
| Daily Pivot Point R3 | 143.89 |
More By This Author:
Forex Today: US Dollar Remains Fragile Ahead Of Mid-Tier US Data
Gold Price Forecast: XAU/USD Rises Toward $2,100 On Dovish Fed Outlook
EUR/USD Holds Above The 1.1100 Mark, US Jobless Claims Data Eyed
Disclosure: Information on this article contains forward-looking statements that involve risks and uncertainties. Markets and instruments profiled on this page are for informational purposes ...
more


