

GDP per capita, consumption per capita, disposable income per capita, unemployment, economic policy uncertainty, VIX, and Misery Index — plus median household income.

Figure 1: GDP per capita now (blue), and four years ago (tan), both in bn.Ch.2017$ SAAR. Source: BEA.
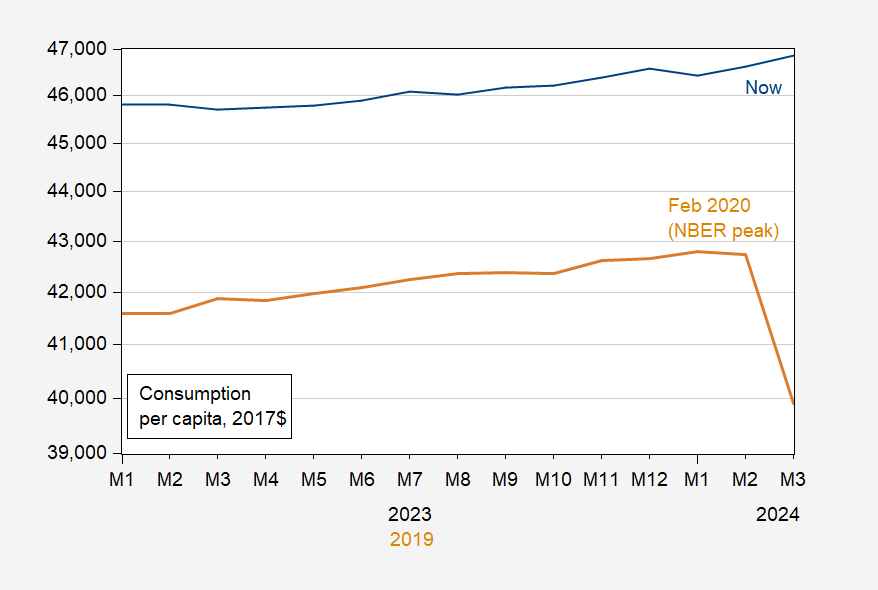
Figure 2: Consumption per capita now (blue), four years ago (tan), in 2017$ SAAR. Source: BEA.
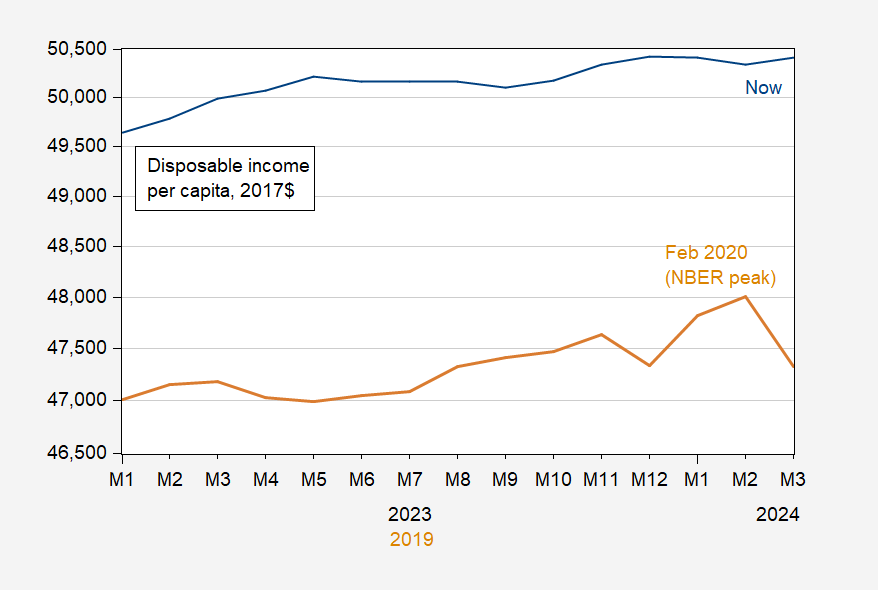
Figure 3: Disposable personal income per capita now (blue), four years ago (tan), in 2017$ SAAR. Source: BEA.
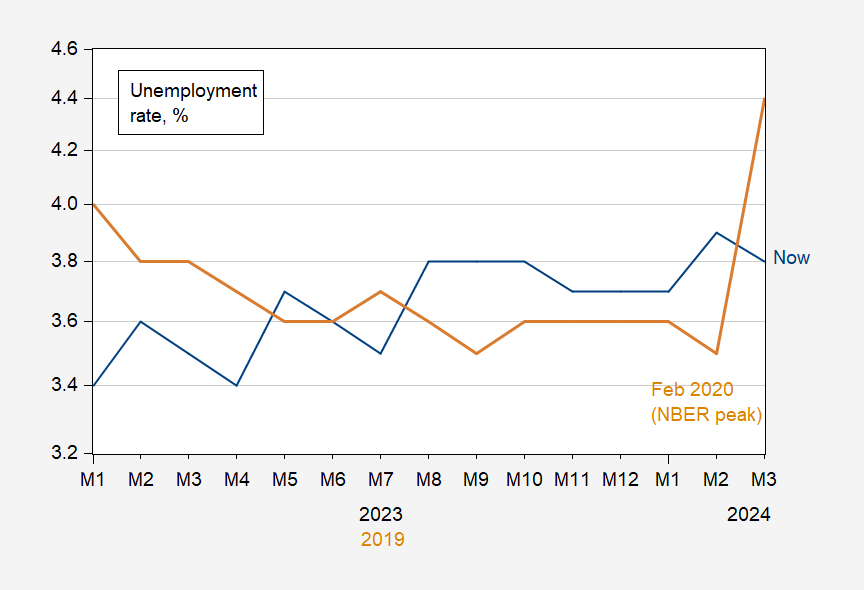
Figure 4: Unemployment rate now (blue), four years ago (tan), in %. April observation is Bloomberg consensus. Source: BLS.
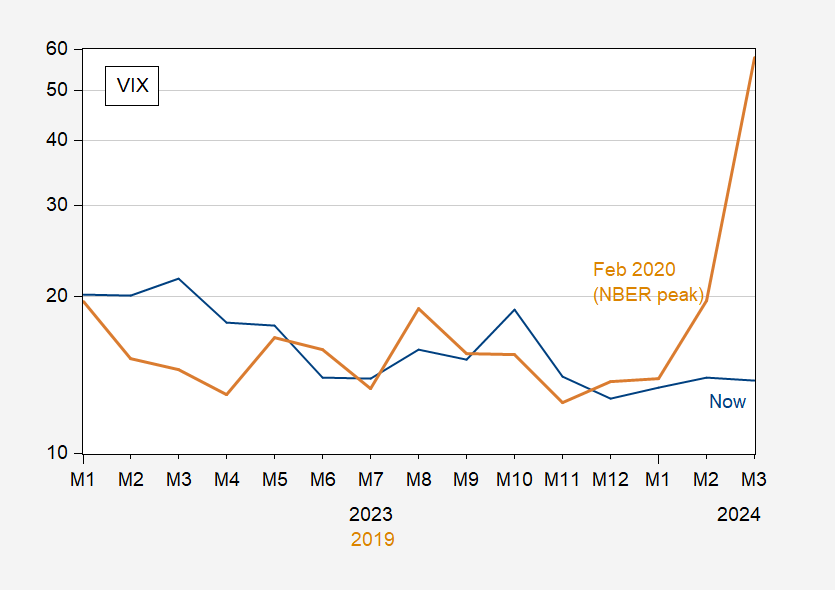
Figure 5: VIX now (blue), four years ago (tan). Source: CBOE via FRED.

Figure 6: Economic Policy Uncertainty index (blue), four years ago (tan). Source: Policyuncertainty.com via FRED.
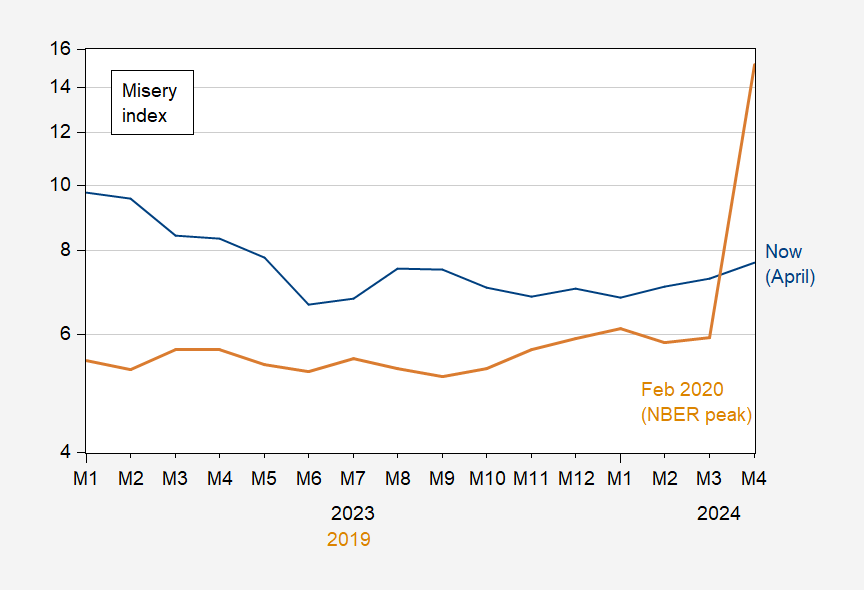
Figure 7: Misery index now (blue), four years ago (tan), in %. April observation of unemployment is Bloomberg consensus, inflation is from Cleveland Fed nowcast as of 4/30/2024. Source: BLS, Cleveland Fed, and author’s calculations.
I don’t have a time series for real median household income index, but I can compare the March 2024 value to February 2020 (which Motio research indicates is the likely peak) value of 115.8.
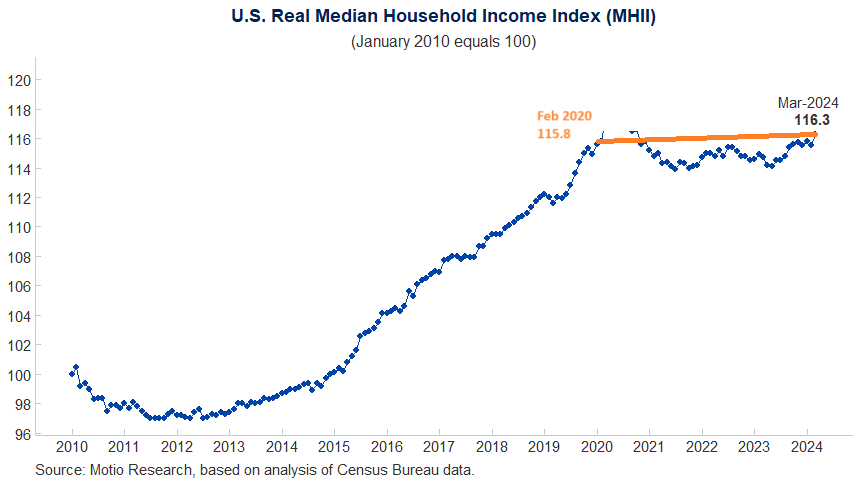
Source: Motio Research.
I’d say, by these measures, the answer is “yes”, even using median income.
More By This Author:
Confidence, Sentiment, And News In April: Some Time SeriesFour Measures Of The Output Gap And Measuring Trends
U.S. Oil Production In 2023, Net Exports Of Petroleum Products Through 2024Q1


Comments
Log in or sign up to join the conversation.