
While we are waiting for new economic data tomorrow, let me pick up on an issue I closed with yesterday: while manufacturing has turned down, goods production in the US economy is being held up by construction, and in particular residential construction. Given the severe hike in mortgage rates as well as house prices, I described it as “levitation.” So today let’s look at that levitation.
As per usual, I always start out with the fact that mortgage rates lead sales. The below graph includes mortgage rates (blue, left scale) compared with housing permits (red, right scale) and the even more leading, but very noisy new single family home sales (gray, right scale). The latter two are normed to their peak at 100:
(Click on image to enlarge)

And as mortgage rates increased from 3% to 7%, sales and permits declined about 20%, +/-5%. This is a serious decline, which has often but not always meant a recession has followed.
For completeness’ sake, here is real private residential fixed spending from the GDP reports compared with single family permits, which have been the least noisy leading housing metric of all. Again, both are normed to 100 as of their peaks, and permits are averaged quarterly for better comparison:
(Click on image to enlarge)

Note that real housing spending in the GDP has declined about 15%.
Next, the noisier housing starts (light orange) follow permits by a month or two. And housing units under construction (which vary by starts minus completions), a which are the “real” aggregate economic activity, follow with a significant delay, in this case by almost 1 year. Note again all three are normed to 100 as of the month of their peaks:
(Click on image to enlarge)

The first act of levitation after the pandemic was how units under construction stayed almost perfectly flat for about 18 months after they approached their peak. Historically this was a very long delay.
But at long last housing units under construction turned down, and did so with a vengeance, now down over 15%, which in the past has been consistent with a recession, although not always. Which leads us to the second act of levitation, which is the number of employees involved in housing construction (gold, right scale):
(Click on image to enlarge)

Employment in residential construction has continued to increase, despite the downturn in every other housing sector metric!
When might we expect this last shoe to drop? Here’s the longer term historical look:
(Click on image to enlarge)
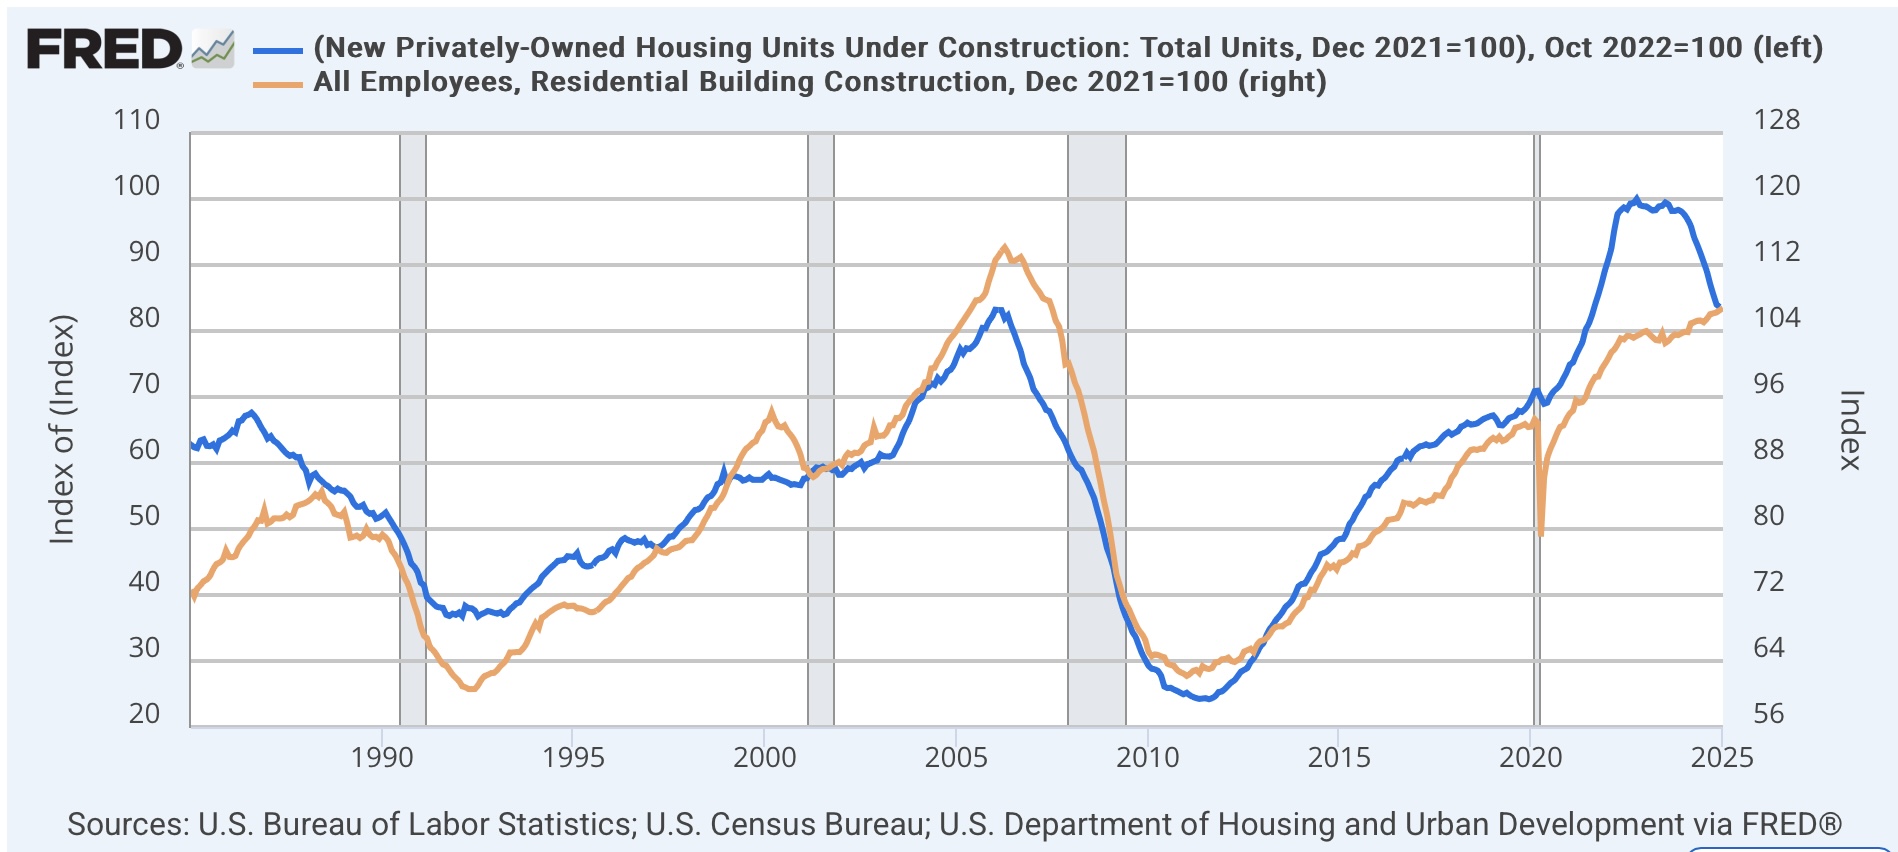
In the case of the 2000s housing bubble, construction employment turned down with only a very slight delay. The 2001 recession was partly a tech bubble, partly the China manufacturing employment shock, and partly the September 11 terrorist attacks, so housing construction did not turn down meaningfully. Residential construction employment peaked 15 months after housing construction turned flat.
Perhaps the closest analogue is the 1980s construction boom. Here is a close-up on that era:
(Click on image to enlarge)

In the 1980s, residential construction employment increased for 22 months after actual construction turned down.
Where does that leave us now? We are currently over two years after the actual peak in construction, and roughly 18 months since it turned down significantly. As the above historical graph shows, the last three organic recessions (i.e., not including the pandemic) started once residential construction employment was down 10% (and the trends in other sectors typically leading recessions also were in place).
I have been looking for residential construciton employment to turn down for at least half of year. My best guess is that it will finally turn down at some point in the next six months, if the remaining economic pieces (especially mortgage rates!) remain in place. Once they do turn down, they may follow a similarly sharp decline as construction already has, which would suggest a recession 12-18 months later on average. Please note this last sentence is *not* a forecast, only an average. There are many other moving parts to consider.
More By This Author:
The Big Convergence: Scenes From The January Employment ReportJanuary Jobs Report: Annual Revisions Clear Up Some Big Discrepancies, But Monthly Numbers Are Close To Pre-Recessionary
Initial And Continuing Claims Join The “Steady As She Goes” Parade


Comments
Log in or sign up to join the conversation.