
All Cap Value Style
The All Cap Value style ranks fifth out of the twelve fund styles as detailed in my Style Rankings for ETFs and Mutual Funds report. It gets my Neutral rating, which is based on aggregation of ratings of 0 ETFs and 258 mutual funds in the All Cap Value style as of July 23, 2014. Prior reports on the best & worst ETFs and mutual funds in every sector and style are here.
Figure 1 shows the five best and worst-rated all cap growth mutual funds. Not all All Cap Value style ETFs and mutual funds are created the same. The number of holdings varies widely (from 7 to 1232). This variation creates drastically different investment implications and, therefore, ratings. The best ETFs and mutual funds allocate more value to Attractive-or-better-rated stocks than the worst, which allocate too much value to Neutral-or-worse-rated stocks.
To identify the best and avoid the worst ETFs and mutual funds within the All Cap Value sector, investors need a predictive rating based on (1) the stocks ratings of the holdings, (2) the all-in expenses of each ETF and mutual fund, and (3) the fund’s rank compared to all other ETFs and mutual funds. As a result, only the cheapest funds with the best holdings receive Attractive or better ratings. Investors need not rely on backward-looking ratings. My fund rating methodology is detailed here.
Investors seeking exposure to the All Cap Value style should buy one of the Attractive-or-better rated mutual funds from Figure 1.
Get my ratings on all ETFs and mutual funds in this style by searching for All Cap Value on my mutual fund and ETF screener.
Figure 1: Mutual Funds with the Best & Worst Ratings – Top 5
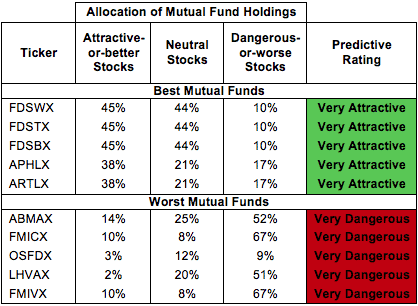
* Best mutual funds exclude funds with TNAs less than $100 million for inadequate liquidity.
Sources: New Constructs, LLC and company filings
Forum Funds: Payson Total Return Fund (PBFDX) is excluded from Figure 2 because its total net assets (TNA) are below $100 million and do not meet our liquidity minimums.
SunAmerica Series, Inc: Focused Dividend Strategy Portfolio (FDSWX) is my top-rated All Cap Value mutual fund and earns my Very Attractive rating.
Virtus Equity Trust: Virtus Mid-Cap Value Fund (FMIVX) is my worst-rated All Cap Value mutual fund and earns my Very Dangerous rating.
Figure 2 shows that 178 out of the 1513 stocks (over 21% of the market value) in All Cap Value ETFs and mutual funds get an Attractive-or-better rating. However, there are no ETFs and 57 out of 258 All Cap Value mutual funds (less than 35% of total net assets) get an Attractive-or-better rating.
Figure 2: All Cap Value Style Landscape For ETFs, Mutual Funds & Stocks
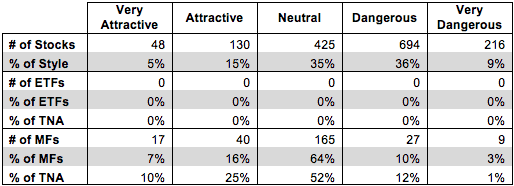
Sources: New Constructs, LLC and company filings
As detailed in “Cheap Funds Dupe Investors”, the fund industry offers many cheap funds but very few funds with high-quality stocks, or with what I call good portfolio management.
Investors need to tread carefully when considering All Cap Value ETFs and mutual funds, as there are no All Cap Value ETFs and only 57 mutual funds in the All Cap Value style allocate enough value to Attractive-or-better-rated stocks to earn an Attractive rating.
Lockheed Martin Corp (LMT) is one of my favorite stocks held by All Cap Value ETFs and mutual funds and earns my Attractive rating. Over the past decade, LMT has grown after-tax profit (NOPAT) by 11% compounded annually. In 2013, the company earned a return on invested capital (ROIC) of 11%, up from 6% in 2003. As one would expect, the stock has performed in tune with this impressive profit growth and is up over 40% in the past year. Despite this large increase, LMT still remains undervalued. At its current price of ~$14/share, LMT has a price to economic book value (PEBV) ratio of 1.2. This ratio implies that the market expects LMT to only grow NOPAT by 20% for the remaining life of the corporation. This expectation is low for a company with LMT’s track record of profit growth.
McDermott International, Inc. (MDR) is one of my least favorite stocks held by All Cap Value ETFs and mutual funds and earns my Dangerous rating. MDR has had a rough time the past five years. In 2009, MDR’s NOPAT was $412 million. Fast-forward to today and NOPAT has declined to -$251 million in 2013. MDR’s ROIC has followed suit, declining to a bottom quintile -9% in 2013, down from 14% in 2009. Despite its struggles, a significant turnaround is priced into MDR’s stock. To justify its current price of ~$6.50/share, MDR must achieve pre-tax margins of 7% and grow revenues by 10% compounded annually for the next 12 years. MDR’s NOPAT at the end of this period would be $580 million, or about what it earned in 2007. MDR bulls have to ask themselves whether this company can really regain its pre-recession profits. If not, MDR is a sell.
Figure 3 show the rating landscape of all All Cap Value ETFs and mutual funds.
My Style Rankings for ETFs and Mutual Funds report ranks all styles and highlights those that offer the best investments.
Figure 3: Separating the Best Mutual Funds From the Worst Funds
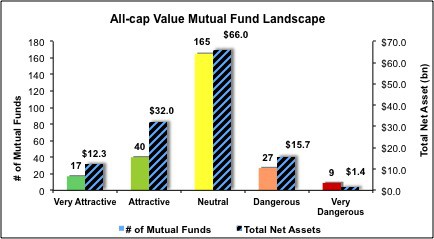
Sources: New Constructs, LLC and company filings
Review my full list of ratings and rankings along with reports on all 0 ETFs and 258 mutual funds in the All Cap Value style.
Disclosure: NewConstructs staff receive no compensation to write about any specific stock, sector, or theme.


