
Investor sentiment has taken a hit in recent weeks and it can continue lower under the right circumstances, although a pause is likely right here and now, helping stocks.
Stocks took it on the nose in September. The S&P 500 (SPX) tumbled 4.8 percent. The large cap index peaked as soon as the month began, ticking 4546 on the 2nd. Sentiment, too, began to weaken right around then.
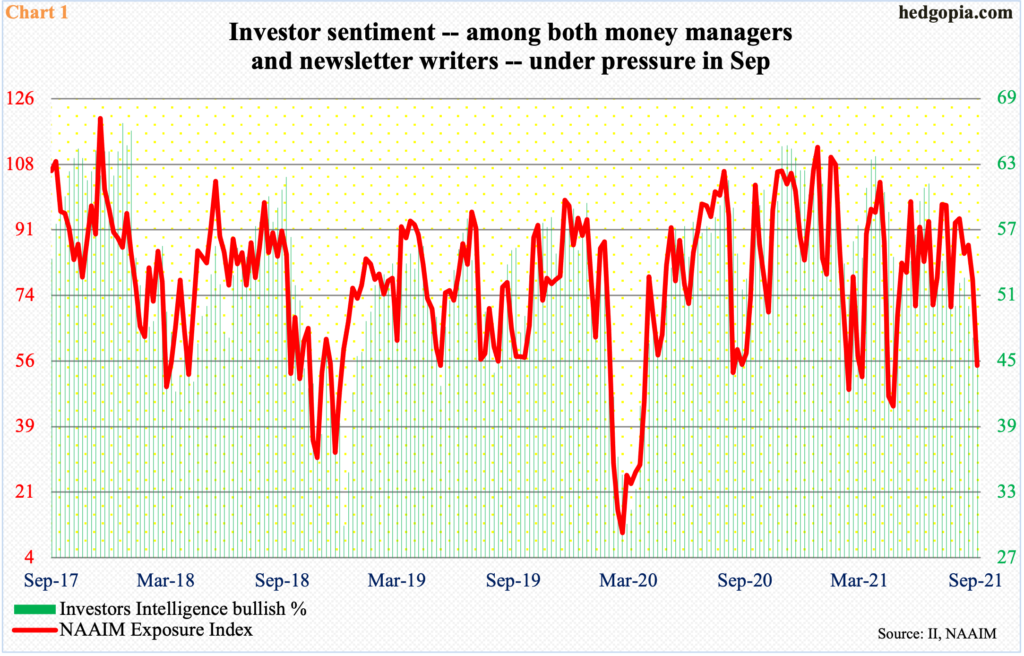
In the week to September 1, the NAAIM Exposure Index, which represents National Association of Active Investment Managers members’ average exposure to US equity markets, stood at 93.95. Last Wednesday, it printed 55.02 – a 19-week low. Similarly, in the week to August 31, Investors Intelligence bulls were 52.1 percent, followed by 52.6 percent in the following week; last Tuesday, their count was 46.5 percent, which is the lowest since April last year (Chart 1).
Both these sentiment measures, one representing money managers and the other newsletter writers, can continue lower before a complete unwinding of the bullish sentiment occurs. Usually, it does not happen in a straight line. On its way to getting unwound, it can always take a break.
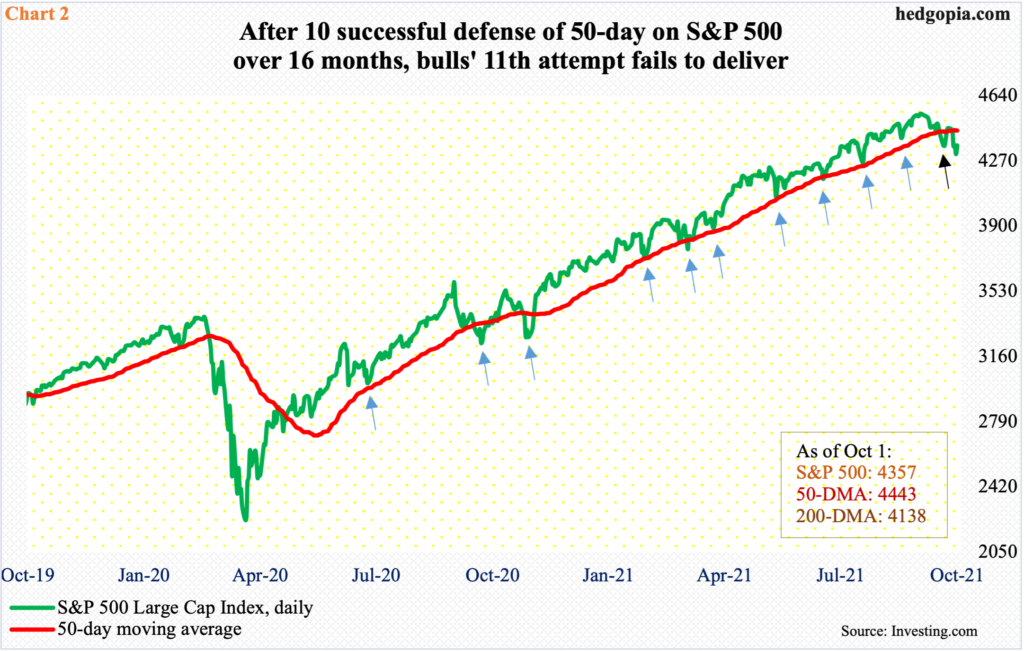
From its September 2 high through last Friday’s low of 4289, the S&P 500 proceeded to lose 5.7 percent. On its way there, the 50-day was breached. From May last year, this was the 11th test of the average. The prior 10 were successful (Chart 2). For a moment, this one, too, looked to be heading the same direction, as the average was reclaimed after three sessions, but only to lose it last week.
Currently, the index is two percent below the average. Odds favor a test in the sessions ahead. Last Friday’s dip to 4289 was bought, ending the week at 4357. The daily is now oversold. If the 50-day is retaken, there is another layer of resistance at 4480s.
A lot will depend on how sentiment evolves – to put it another way, how, or if, money managers and newsletter writers are willing to put new money to work taking advantage of the latest dip.
Longer-term, September was the first down month after seven consecutive positive months – and in nine out of the last 11. Importantly, it was an outside month, where sellers were in control. How October evolves is very important.
This is also true with the Nasdaq 100 (NDX), which, too, suffered an outside month in September, down 4.8 percent. This was the first down month in four, second in five and third in 11.
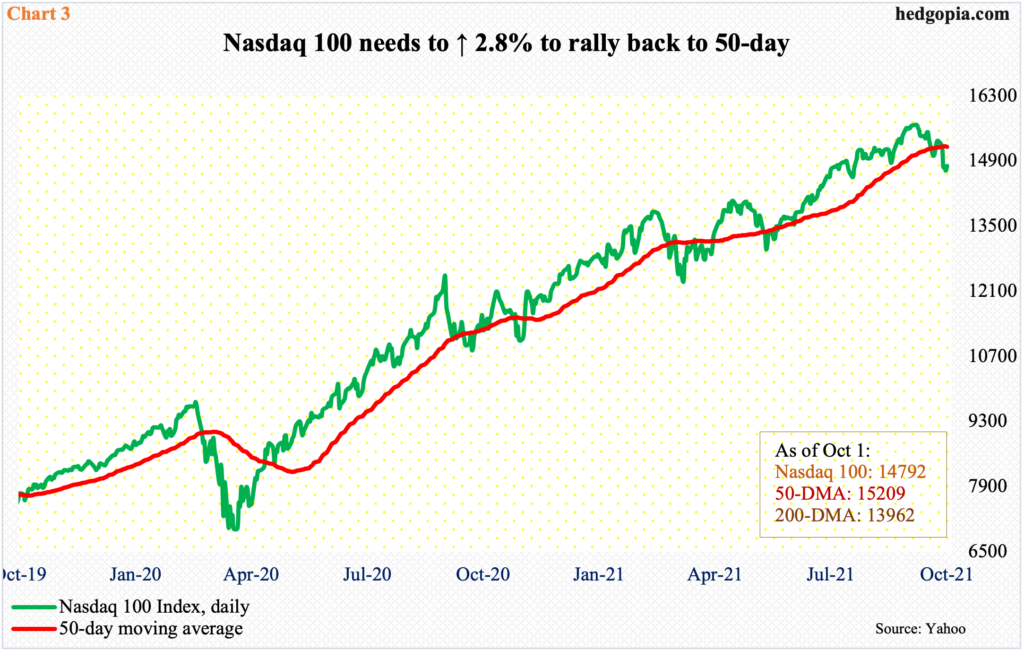
The tech-heavy index is 2.8 percent from its 50-day, which – as is the case with the S&P 500 – is now flat to slightly down (Chart 3). Last Friday’s intraday low of 14555 was bought, with a hammer close of 14792. The average likely gets tested in the sessions ahead. Before that, there is gap-down resistance at 15000.
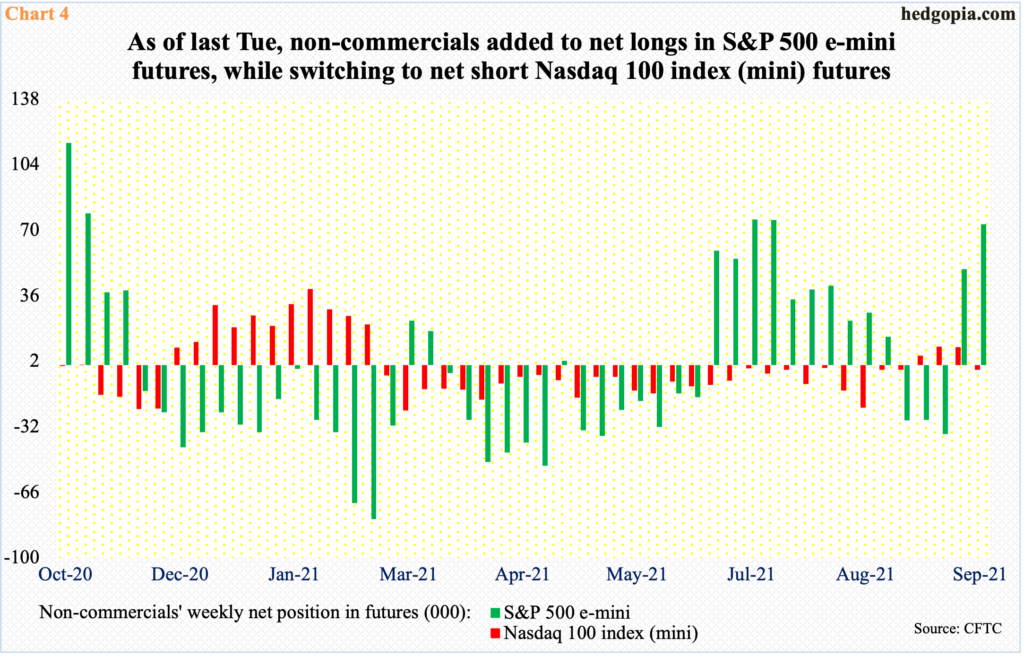
Rather interestingly, the way non-commercials were positioning themselves as of last Tuesday can be revealing.
In S&P 500 e-mini futures, after three weeks of staying net short, they went net long in the week to September 21. Then, in the week to September 28, they added 23,342 contracts to 73,157 – an 11-week high (Chart 2). In contrast, in Nasdaq 100 index (mini), they added 11,702 contracts last week to go net short 2,280; prior to this, they had stayed net long for three weeks (individual charts here).
It is just one week’s data, so it is too early to definitively conclude as to how these traders are thinking. But it is possible their decision process is influenced by how interest rates are behaving.
As things stand, the popular thinking is that tech will get hurt by rising rates. If rising rates are the result of sustained economic growth, there is no reason why tech should suffer. But right here and now, traders have adopted an inverse relationship between rates and tech.
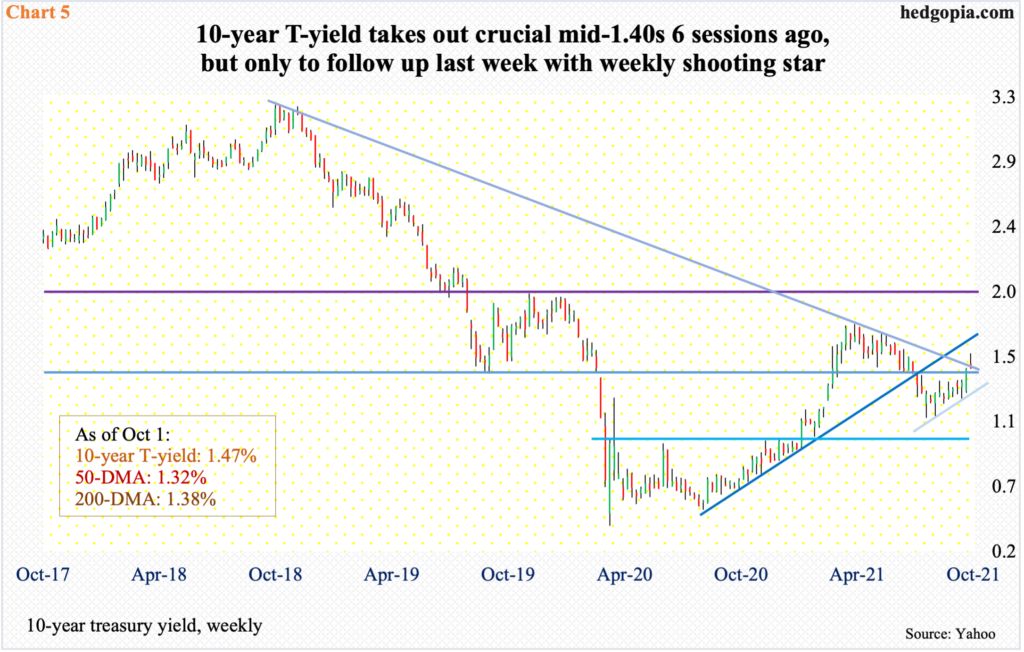
The 10-year treasury (SPTL) yield rallied five basis points last week to 1.47 percent. This was the sixth straight positive week – and eighth in the last nine. In early August, it bottomed at 1.29 percent, and has trended higher since. Last Tuesday, in a spinning top session, rates rallied as high as 1.57 percent. This preceded the reclaiming of crucial mid-1.40s on September 24.
In February last year, the 10-year breached that level and went on to tick 0.4 percent in the following month. It was not until February this year that bond bears (on price) were able to reclaim the level. Rates then peaked at 1.77 percent on March 30, before once again proceeding to lose it in early July. This time around, it took the bears two and a half months to reclaim the level.
The daily is overbought. Breakout retest is the path of least resistance. Odds favor a failure. Last week, in a sign of fatigue, a shooting star showed up on the weekly. Once mid-1.40s is lost, bond bears can still defend straight-line support at 1.38 percent, which is where the 200-day lies. After that rests trend-line support at 1.34 percent going back to early August.
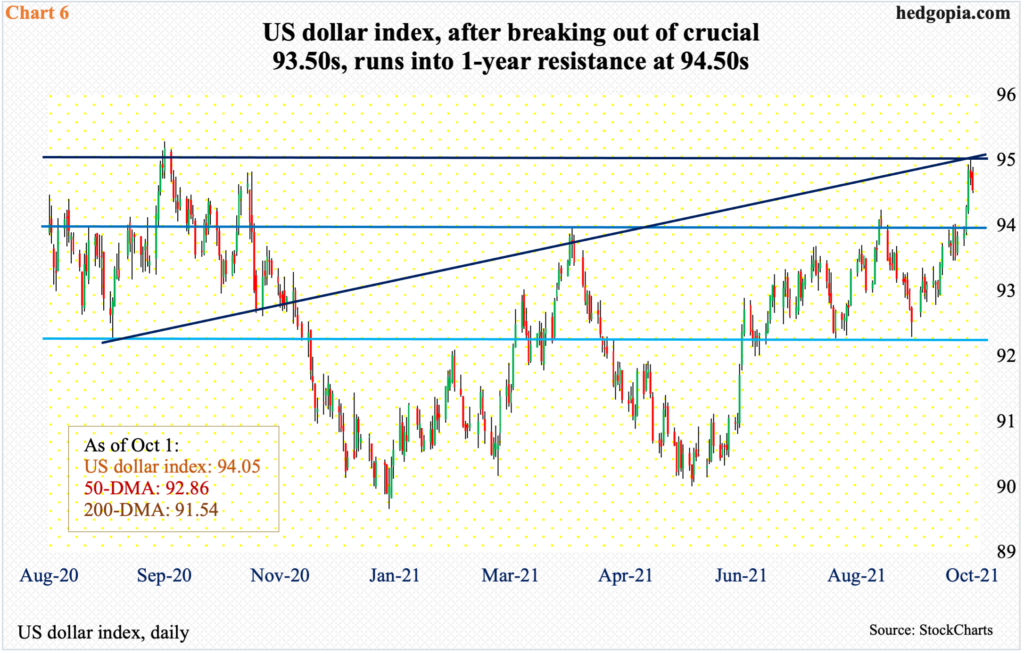
In the event the 10-year continues lower, this could also provide a headwind for the dollar. The US dollar index broke out of 93.50s last Tuesday. This made up the neckline of a reverse-head-and-shoulders pattern. This could also be a W setup. The measured move of a breakout could potentially lead to 97-98 (USD).
At the same time, there is major resistance around 95. The index tagged 94.52 last Thursday before backing off. Right around there also lies trend-line resistance from August last year (Chart 6). This raises the odds that the US dollar index will begin to unwind the overbought condition it is in. Breakout retest at 93.50s is worth a watch. If it fails, this should help put the 10-year yield under more pressure, which, in turn, should help tech stocks in particular.
Thanks for reading!


Comments
Log in or sign up to join the conversation.