
Briefly:
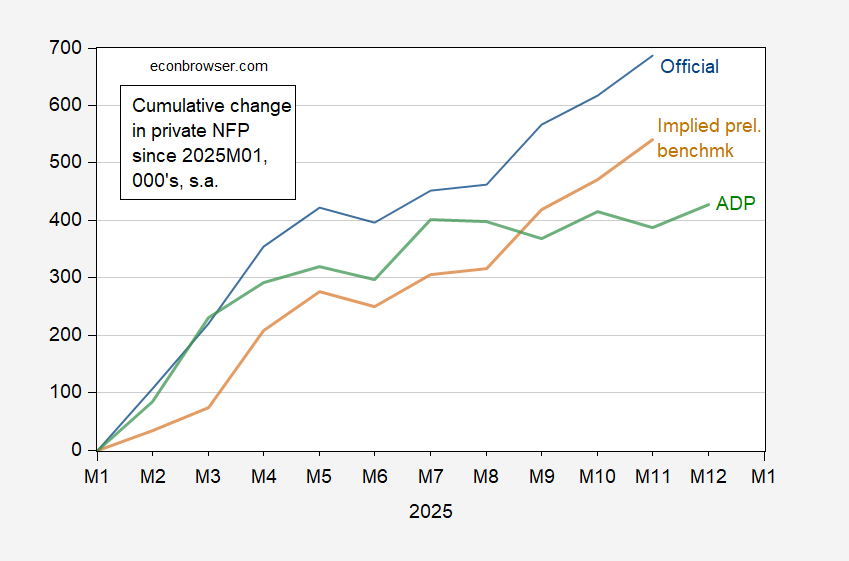
Figure 1: Change since January 2025 in private nonfarm payroll employment, BLS official (blue), implied preliminary benchmark BLS private NFP (brown), and ADP private NFP (green), all in 000’s, s.a. Source: BLS, ADP via FRED, BLS, and author’s calculations.
To place things in perspective, here is the ADP series against some alternative business cycle indicators (for those followed by NBER’s Business Cycle Dating Committeee, see this post).
(Click on image to enlarge)
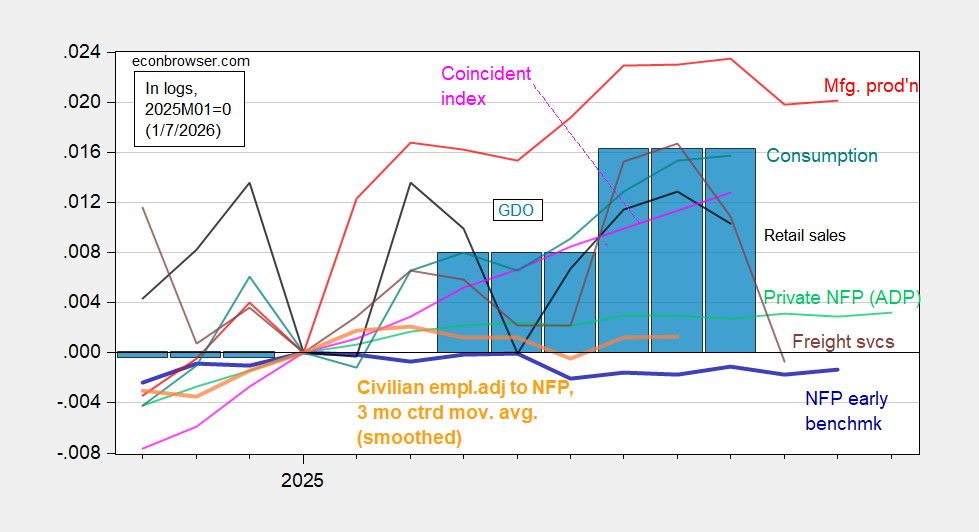
Figure 2: Implied Nonfarm Payroll early benchmark (NFP) (bold blue), civilian employment adjusted to NFP concept, smoothed population controls and 3 month centered moving average (bold orange), manufacturing production (red), consumption in Ch.2017$ (teal), real retail sales (black), freight services index (brown), and coincident index in Ch.2017$ (pink), GDO (blue bars), all log normalized to 2025M01=0. Source: Philadelphia Fed [1], Philadelphia Fed [2], Federal Reserve, BTS via FRED, BEA 2025Q3 initial release, and author’s calculations.
Since January, aggregate output measures have risen more than employment measures, which have generally trended sideways.
On the other hand, the large firm/small firm employment divergence was held in abeyance in December (prel.) numbers:
(Click on image to enlarge)
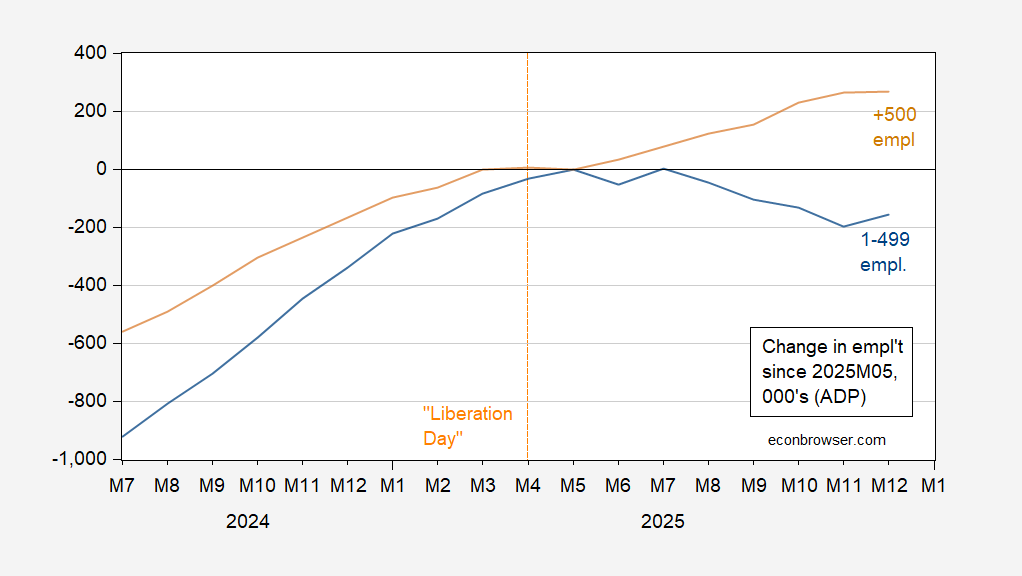
Figure 3: Cumulative change since 2025M04 in employment in firms with employment > 500 (tan), employment 1-499 (blue), in 000’s, s.a. Source: ADP, and author’s calculations.
This occurred in July, but only for a month, so one would want to see more observations to see whether the convergence was established.
Finally, manufacturing continues its downward trend insofor as the ADP series is concerned:
(Click on image to enlarge)
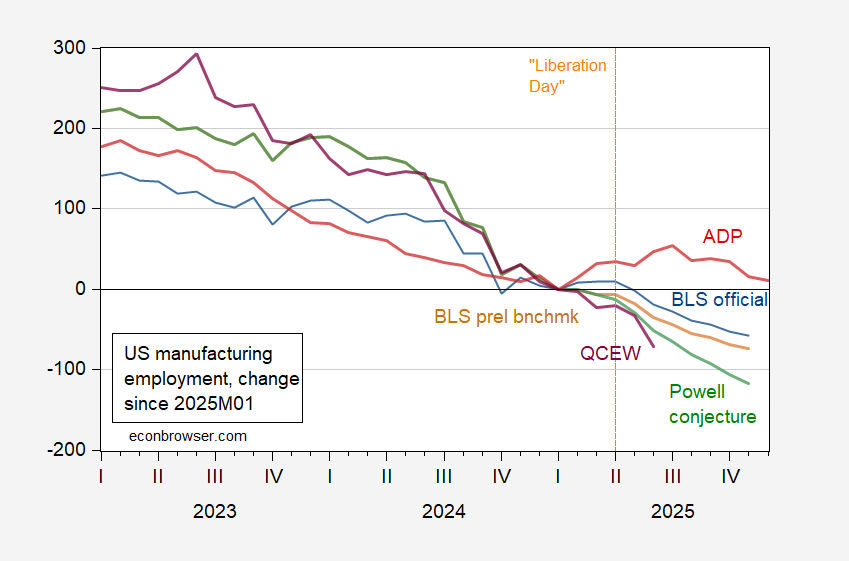
Figure 4: Change since 2025M01 in manufacturing employment from BLS (blue), from implied preliminary benchmark (brown), in Powell conjecture prorated applied to implied preliminary benchmark (green), QCEW covered manufacturing seasonally adjusted using X-13 (in logs) by author (purple), and ADP (red), all in 000’s, s.a. Source: BLS via FRED, BLS, ADP, and author’s calculations.
ADP manufacturing is essentially where it was in January. QCEW measures (from a census, not a survey) is decidedly below by June. While gross manufacturing output is above January levels (see Figure 2 above), it’s now below September peak. Where’s that tariff-induced manufacturing renaissance we were promised?
More By This Author:
Auto Loans Further DeteriorateRussian GDP In Question
Six Estimates Of Nonfarm Payroll Employment


Comments
Log in or sign up to join the conversation.