
Here are some some observations to complement Jim’s post on the GDP release .

- Final sales (i.e., excluding inventory accumulation) show a different picture than GDP.
- Gross Domestic Output and GDP follow different trajectories
- GDP follows a different path from other key indicators
- Economic activity appears to be geographically broadly based
On the first point, GDP is higher than final sales of domestic product (GDP minus inventory accumulation), but has a different gradient in Q2 — increasing rather than decreasing. Final sales to private domestic purchasers, which is sometimes used to infer intrinsic domestic demand, was flat.

Figure 1: GDP (blue), final sales of domestic product (tan), and final sales to private domestic purchasers (green), all in bn. Ch.2012$ SAAR, on log scale. NBER defined peak-to-trough recession dates shaded gray. Source: BEA and NBER.
What is the actual level of economic activity, the “Y” in macro models? GDP measures it from the expenditure side, while GDI measures it from the income side, and the two should equal. The disparity in Q1 was at record levels; In Q2, we don’t yet have GDI, but if real GDI was flat (as real personal income excluding current transfers was), then, we have the following picture:
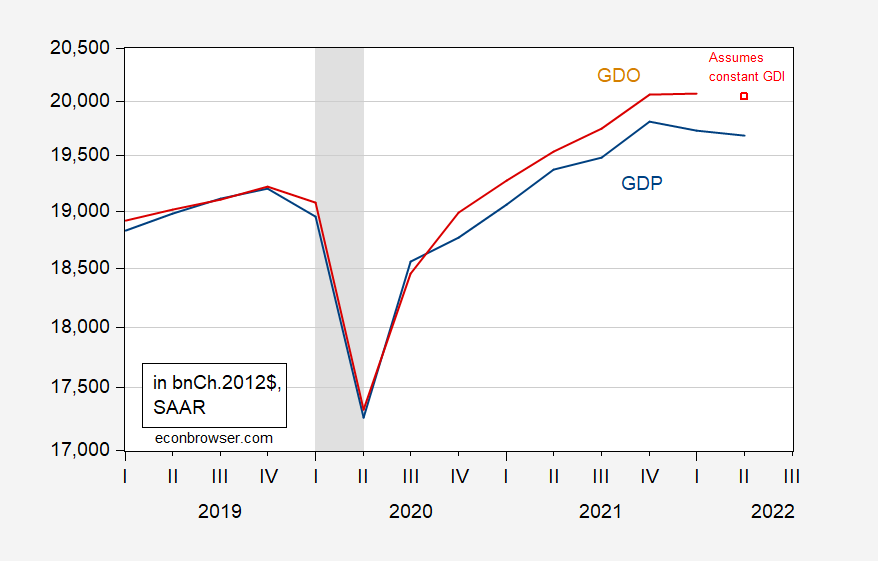
Figure 2: GDP (blue), GDO (red), and GDO assuming real GDI constant in 2022Q2 (red square), all in bn. Ch.2012$ SAAR, on log scale. NBER defined peak-to-trough recession dates shaded gray. Source: BEA, NBER, and author’s calculations.
Then GDO declines in Q2, while being essentially flat in Q1. (GDI and personal income follow each other fairly well.) Why does this matter? As Furman (2016) notes:
It turns out that an equal-weighted average of the [GDP and GDI] is close to the optimal way to combine them, since the average of GDP and GDI more closely tracks the most up-to-date estimates of GDP growth and is a better predictor of future economic growth than either GDP or GDI alone.
This observation backs the view that, in future revisions, reported GDP will likely be revised upward.
Finally, recognizing that GDP is going to be revised numerous times as additional data comes in, what do other indicators suggest is happening to economic activity?
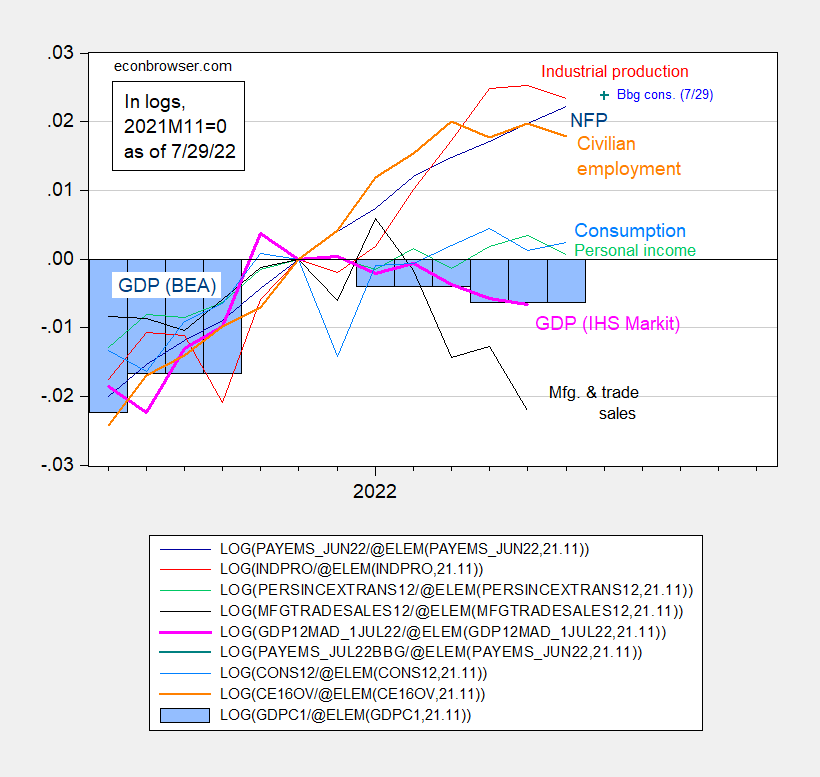
Figure 3: Nonfarm payroll employment (dark blue), Bloomberg consensus as of 7/29 (blue +), civilian employment (orange), industrial production (red), personal income excluding transfers in Ch.2012$ (green), manufacturing and trade sales in Ch.2012$ (black), consumption in Ch.2012$ (light blue), and monthly GDP in Ch.2012$ (pink), official GDP (blue bars), all log normalized to 2021M11=0. Source: BLS, Federal Reserve, BEA, via FRED, IHS Markit (nee Macroeconomic Advisers) (7/1/2022 release), NBER, and author’s calculations.
It’s clear that many indicators have continued to grow past the putative peak of 2021Q4 that one would get based on GDP data as currently reported. The two most highly weighted series — nonfarm payroll employment and personal income excluding current transfers — have diverged from GDP, most profoundly for the former.
Other indices also point to a different path than GDP. Here’s the Philadelphia Fed’s coincident index compared to IHS Markit’s monthly GDP.
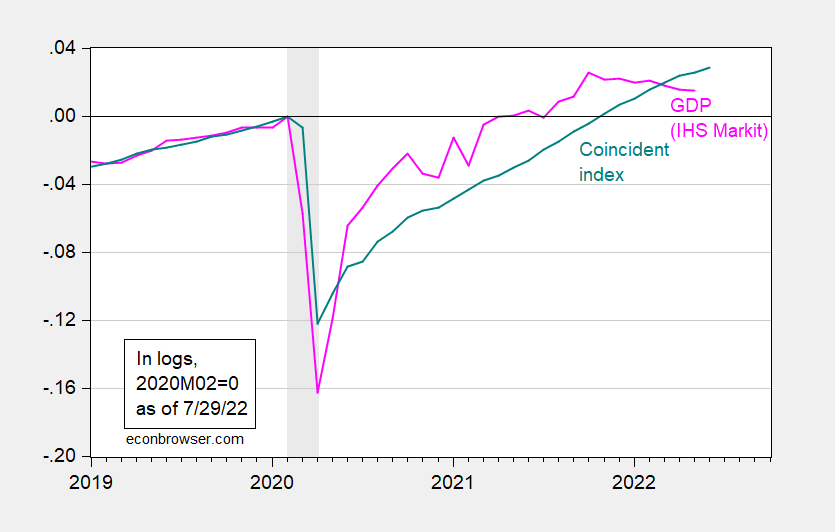
Figure 4: Monthly GDP in Ch.2012$ (pink), coincident index (teal), both log normalized to 2021M11=0. Source: BLS, Federal Reserve, BEA, via FRED, IHS Markit (nee Macroeconomic Advisers) (7/1/2022 release), Philadelphia Fed, NBER, and author’s calculations.
It’s of interest to note that geographically, economic activity as measured by the coincident index has been rising over the last three months (so, 2022Q2) all across the Nation, save Alaska and Montana.
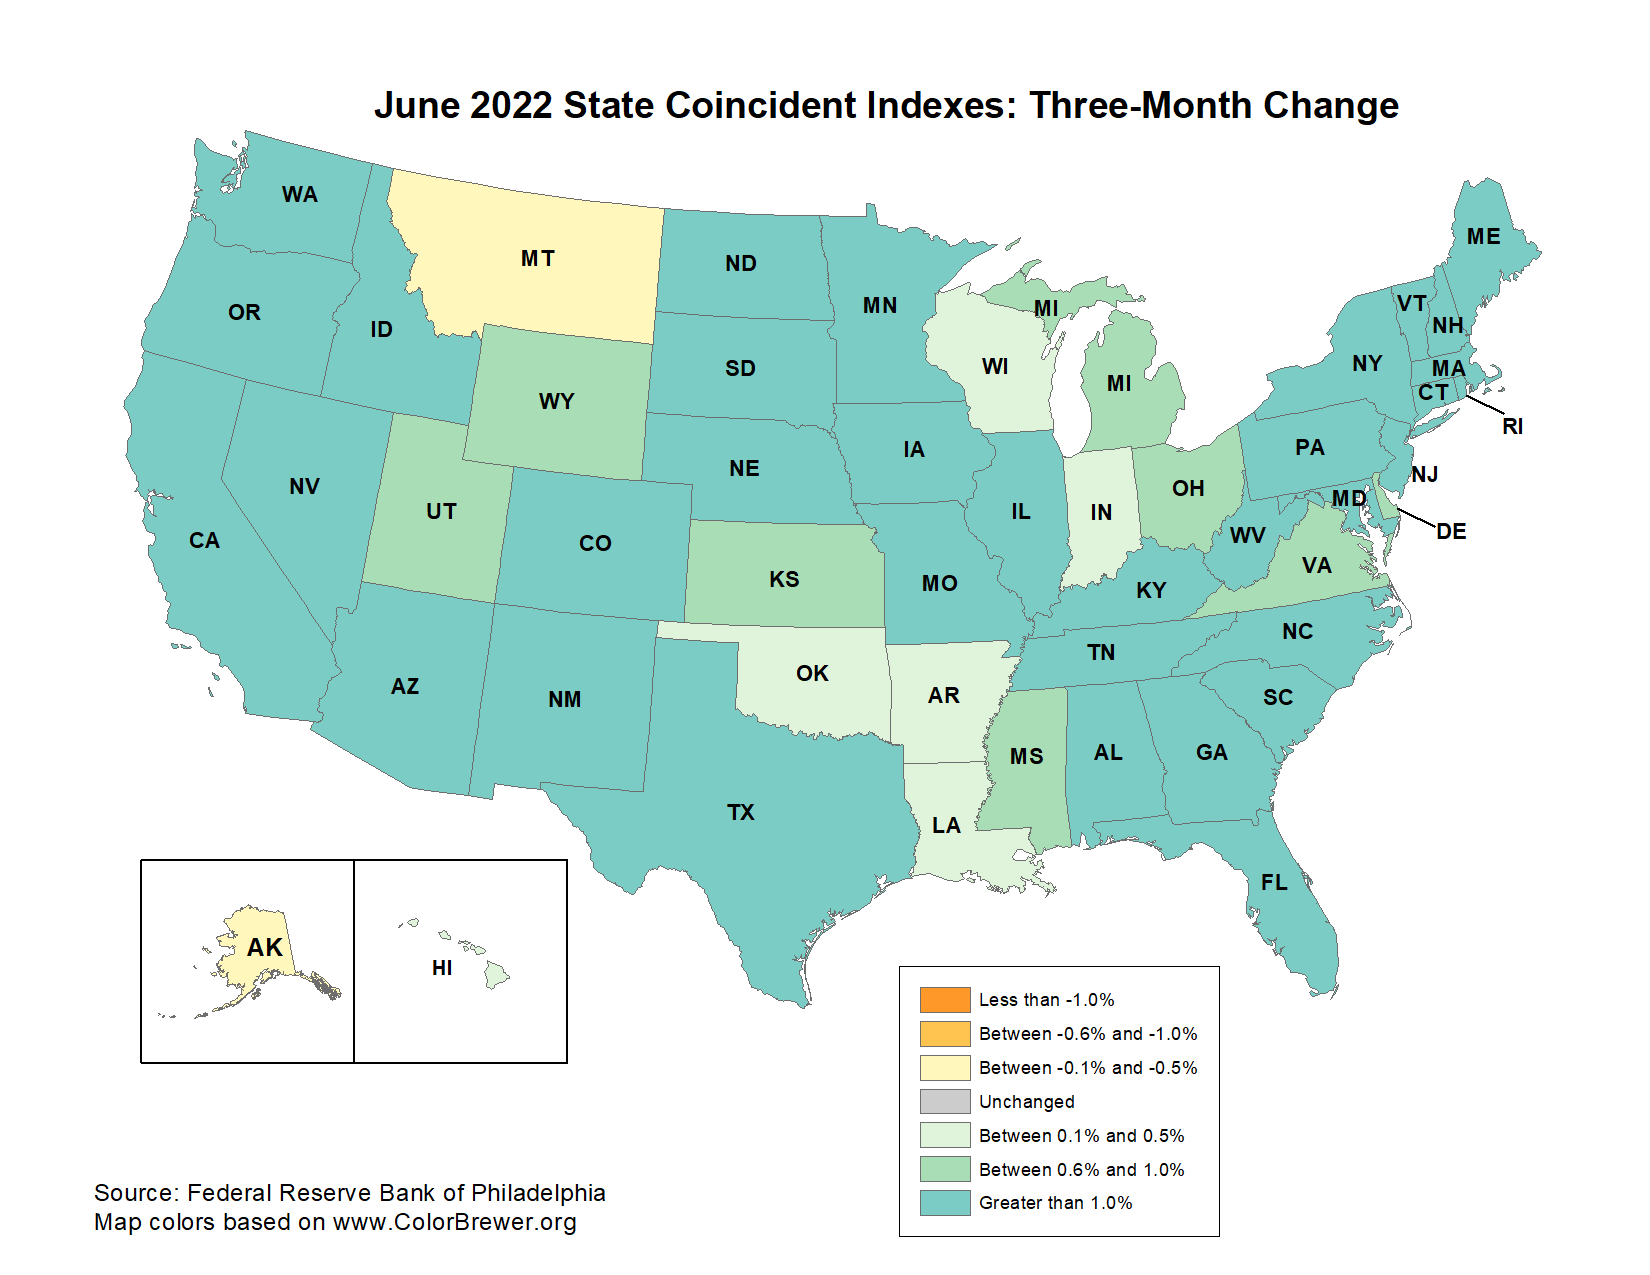
Source: Philadelphia Fed, accessed 7/29/2022.
The Baumeister et al. Weekly Economic Conditions Indicators (data through 6/25) agrees on a slowdown in Alaska, but not for Montana (Utah is in the doldrums according to WECI).
All in all, reading beyond the headlines, economic activity seemed to continue to increase through Q2.
More By This Author:
Business Cycle Indicators as of July 27Nowcasts and Forecasts of 2022Q2 GDP Growth
The China Outlook from the WEO


Comments
Log in or sign up to join the conversation.