
Above The 40 – The S&P 500 Makes A Signature Close To May Trading
AT40 = 43.8% of stocks are trading above their respective 40-day moving averages (DMAs)
AT200 = 52.6% of stocks are trading above their respective 200DMAs
VIX = 10.4 (volatility index)
Short-term Trading Call: cautiously bullish
Commentary
And just like that, the stock market made it even harder for me to keep a bullish bias on my short-term trading call.
Financials suffered a major blow when J.P. Morgan (JPM) revealed that revenue is down 15% in the quarter (excluding June). Bank of America (BAC) piled on by indicating trading revenue would be down year-over-year on tough comparisons. Traders acted swiftly and created serious and bearish technical damage.
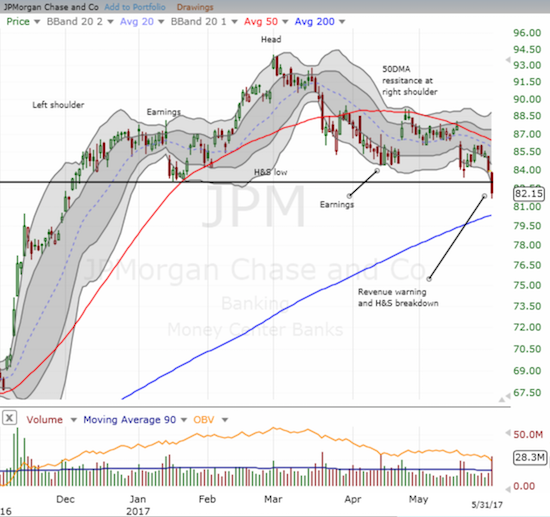
JP Morgan broke down to a new 2017 low and a bearish follow-through on a head and shoulders (H&S) top.
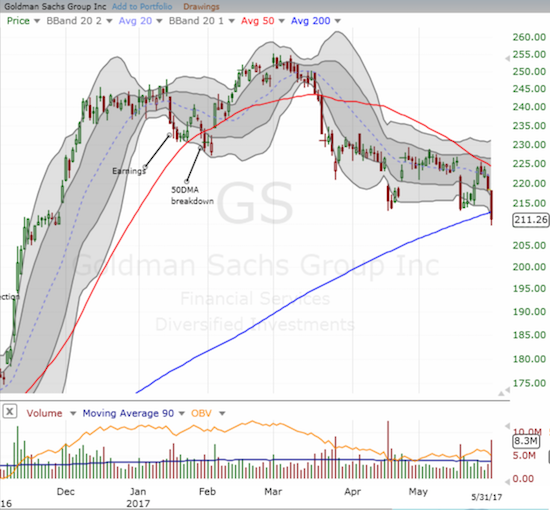
Goldman Sachs (GS) not only made a new 2017 low, but it also made a bearish break through support at its 200-day moving average (DMA).
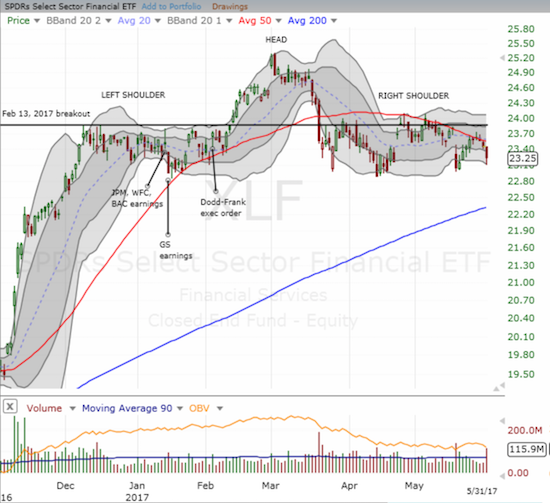
Somehow, the Financial Select Sector SPDR Fund (XLF) has yet to complete a bearish H&S breakdown
The Financial Select Sector SPDR Fund is the only thing preventing me from jumping all over shorts on JPM and GS…and implicitly becoming even less bullish on the stock market. XLF has yet to follow-through on a head and shoulders (H&S) top. I am watching this important indicator of market and economic health ever more closely.
Financials weakened the S&P 500 (SPY). Yet, after sellers failed to make fresh intraday lows from the first hour of trading, buyers closed out the final 90 minutes in a strong rush to scoop up “bargains.” It was yet another signature close for the S&P 500 that put the weakness of sellers on full display even as carnage raged in an important sector of the market.
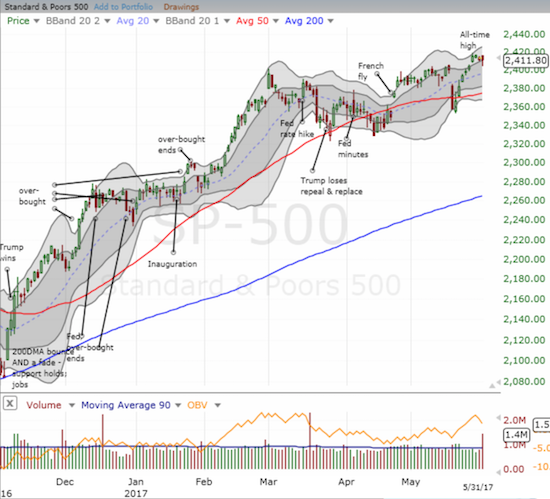
The S&P 500 survived early selling to close out May within inches of its all-time high.
As a result of another implosion of selling interest, the volatility index, the VIX, flipped from an intraday 8.9% gain to a near flat close. The VIX thus stayed firmly entrenched at an extremely low level.
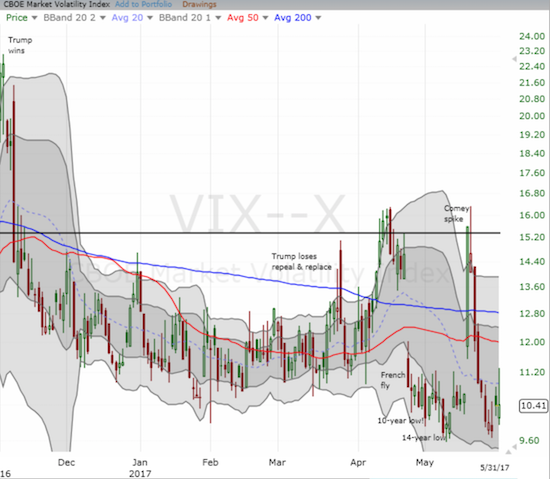
The volatility index, the VIX, ended a tumultuous May at an extremely low close.
Through it all, AT40 (T2108), the percentage of stocks trading above their respective 40DMAs, jumped off its intraday low of 39% to close at 43.8%, a very slight gain over the previous day. Albeit small, this gain was important for indicating that weakness in financials failed to further weaken important underlying technicals of the stock market. Moreover, any bounce for AT40 from the 30% range gets my attention as a potential bottoming move.
AT200 (T2107), the percentage of stocks trading above their respective 200DMAs, was not so fortunate and failed to support an optimistic interpretation of the day’s events. AT200 bounced from 51% but still ended the day with a loss and its third lowest close since the November U.S. Presidential election.
This trading action brings the market into summer trading on a very mixed note. Two key economic reports – the May jobs report and the monetary policy report from the U.S. Federal Reserve – could have extra influence on what happens. At least the fate of the U.S. dollar index (DXY0) hangs in the balance…
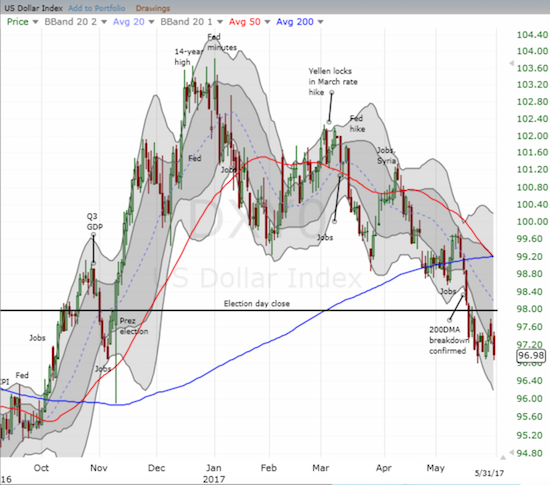
The U.S. dollar index teeters on a fresh breakdown that would further confirm on-going dollar weakness.
Amazon.com (AMZN) will also be on everyone’s radar as the stock flirts with a historic $1000 trading level. AMZN crossed the $1000 threshold over the last two trading days but failed to close there. Today, the stock made an impressive recovery from its intraday low as it traversed the entire upward trending upper-Bollinger Bands (BBs). Something tells me the most willing sellers were already flushed out in this move…
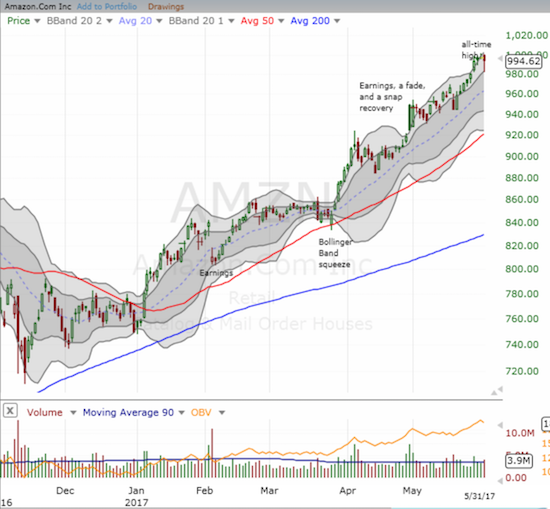
Amazon.com trades near an all-time high as it flirts with a historic $1000 level.
Active AT40 (T2108) periods: Day #321 over 20%, Day #141 over 30%, Day #8 over 40% (over period), Day #11 under 50%, Day #23 under 60%, Day #93 under 70%
Daily AT40 (T2108)

Black line: AT40 (T2108) (% measured on the right)
Red line: Overbought threshold (70%); Blue line: Oversold threshold (20%)
Weekly AT40 (T2108)

*
All charts created using freestockcharts.com unless otherwise stated
The charts above are my LATEST updates independent of the date of this given AT40 post. For my latest AT40 post click here.
Disclosure: Net short the U.S. dollar, long UVXY call options
QQQ is used as a proxy for a Nasdaq-related ETF
Follow Dr. Duru’s commentary on financial markets via more


Thanks DrGuru