

Image Source: Pexels
Yesterday’s piece originally went up with a different title. When I began writing in mid-morning, the modest selling that had occurred up to that point seemed to be more about moves into less risky, more defensive sectors, than about a major change in market sentiment. Thus, the original title was “Today is Rotation”. But a few minutes after the piece was posted, I had misgivings and added the phrase “, So Far” to the title.I’m glad I did.
Once again, things have begun to change since I started writing. The S&P 500 (SPX) and Nasdaq 100 (NDX) have recouped about half their losses in that time, with dip buyers stepping around 11AM EDT.But as we saw yesterday at this time, only three SPX sectors are down on the day right now, and two of them are Communications and Technology (the other is Consumer Discretionary, mainly thanks to Target’s (TGT) post-earnings reaction). We’ve changed back to a market condition that is more about rotation than the outright risk aversion that prevailed earlier today.
The precipitating factor behind this morning’s selloff was the President’s call for Federal Reserve Governor Lisa Cook’s resignation. Last night, Bloomberg reported that Federal Housing Finance Agency (FHFA) Director Bill Pulte called on Attorney General Pam Bondi to open investigation into Cook over two mortgage applications.Markets were not perturbed that there are inquiries into the propriety of her personal mortgage applications.She is entitled to due process, like any other person, which includes the presumption of innocence.If she’s guilty, then she should indeed resign or be fired.But when the President weighed in even before the process began, it raised the specter of politicization and interference in the Fed’s independence.That put markets on the wrong foot early, and negative momentum ruled again – at least for a couple of hours.
For proof of this assertion, note the chart of overnight and pre-market ES and NQ futures.The President’s resignation call hit Truth Social at 8:32 EDT.There is a clear “before” and “after” response to the post.
1-Day, Since 5PM CDT: ES (green/red candles) and NQ (blue line) September Futures, with vertical line at 7:32 CDT (8:32 EDT)
(Click on image to enlarge)
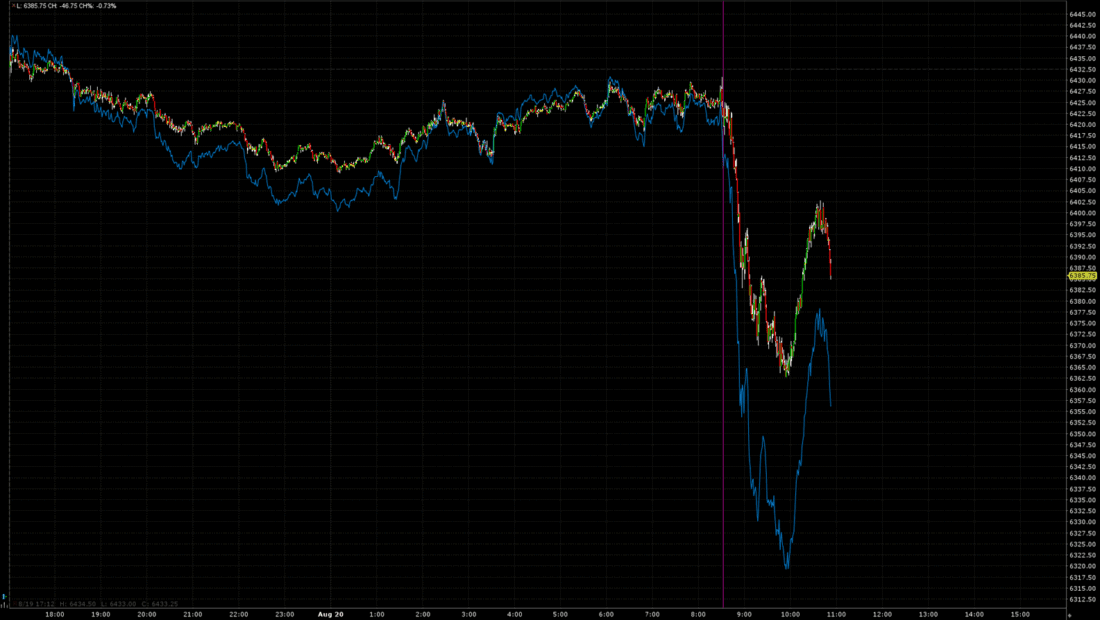
Source: Interactive Brokers
The selling exhaustion is also clearly visible on the above chart. Almost exactly 1.5 hours after the market opened it’s as though someone rang another bell to signal that it was time to buy. Some technical analysis seems to have come into play, specifically the 2 standard deviation Bollinger Band:
NDX, 6-Month Candles, with 2 STD, 10-day Bollinger bands (blue) and 100-day Moving Average (orange)
(Click on image to enlarge)
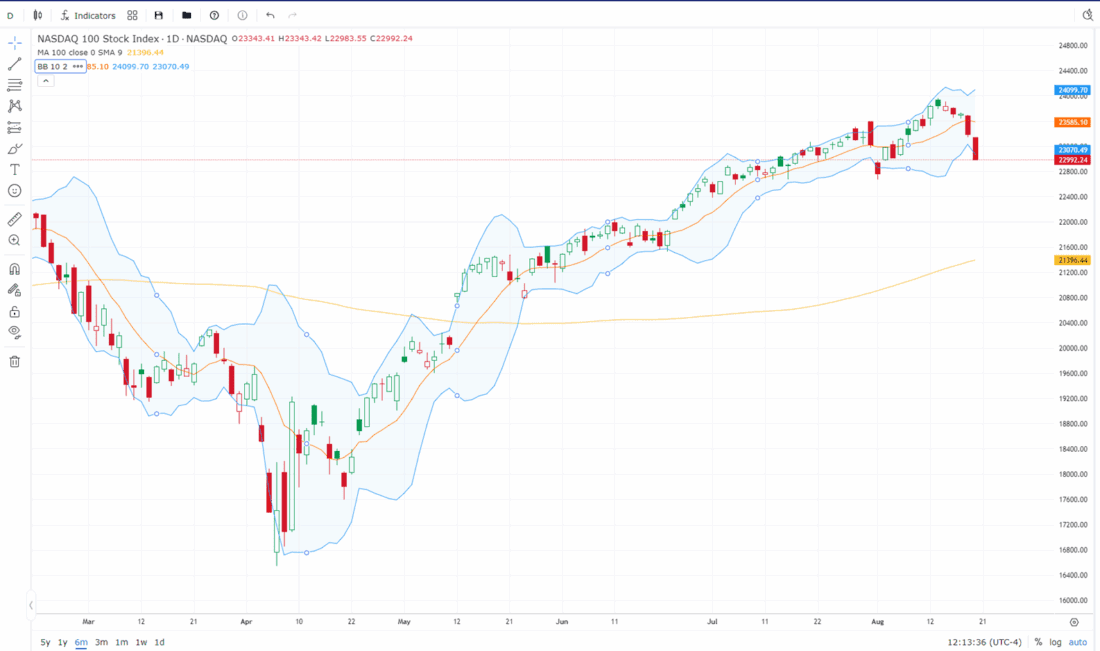
Source: Interactive Brokers
There is nothing inherently meaningful about Bollinger Bands, but the two standard deviation range is clearly meaningful to traders. A self-fulfilling indicator can prove itself correct regardless of rationale.Considering how well this indicator has defined buy and sell points for NDX recently, it is quite understandable why traders would continually utilize it.
Finally, it is clear that traders are still relatively sanguine about the potential for near-term volatility. The Cboe Volatility Index (VIX) has been creeping off its lows but is still hardly anticipating much movement in VIX’s 30 calendar day range. Nor is there much priced into the VIX9D, which utilizes options with an average 9 calendar days to expiration. If investors were truly risk averse ahead of Powell’s speech and Nvidia’s (NVDA) earnings, they aren’t really showing it.
1-Month VIX (red/green hourly candles), VIX9D (blue discontinuous line)
(Click on image to enlarge)
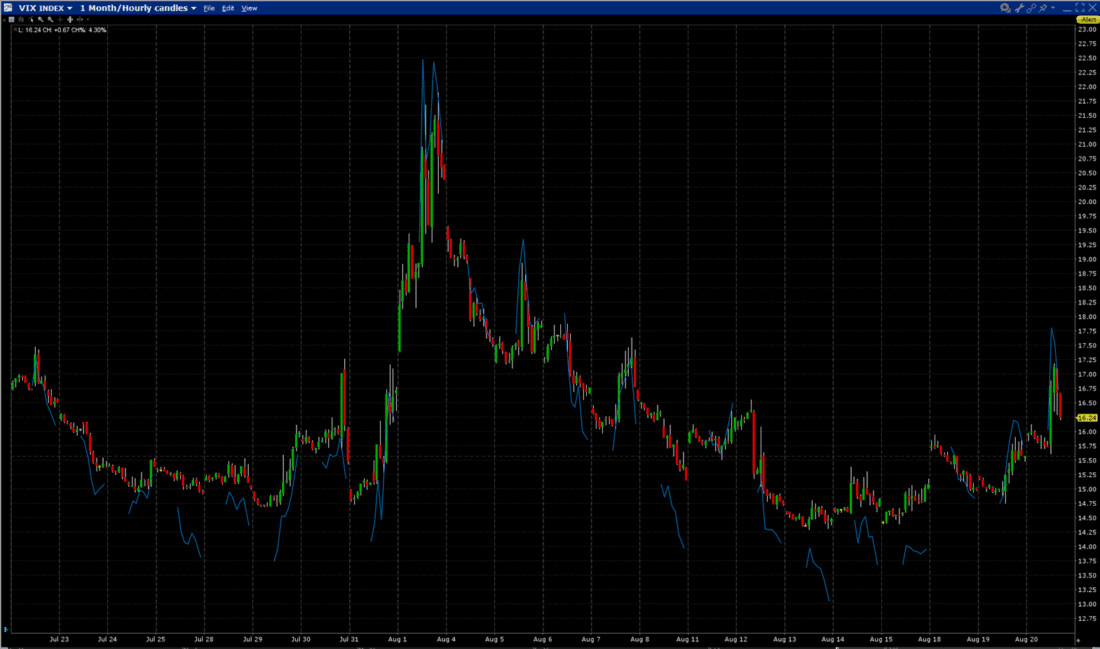
Source: Interactive Brokers
More By This Author:
Nihilism Or Meatballs?
Messages From The Yield Curve
Short-Termism Rules


Comments
Log in or sign up to join the conversation.