
A Thematic Trump Trade Comes To An End
One by one Trump Trades have unwound and completely reversed all their gains (or losses) since the U.S. Presidential election last November. I find the end of this particular Trump Trade particularly thematic.
On June 21, 2017, the VanEck Vectors Russia ETF (RSX) completed a full reversal of its gain since the election of Donald Trump.
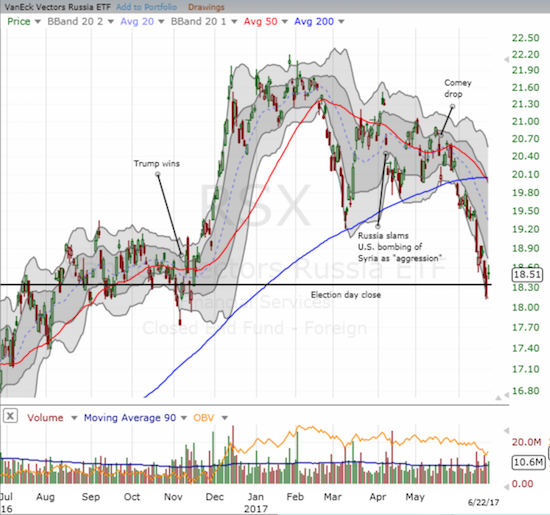
The VanEck Vectors Russia ETF (RSX) is down 12.8% year-to-date a day after reversing its post-election gains.
Source: FreeStockCharts.com
The horizontal line in the graph above represents the closing price of RSX on election day. I realize observers may quibble with my timing of RSX’s reversal. After all, RSX gapped higher the day after the election only to sell-off subsequently for three days in a row. However, I consider this selling as representative of the remaining selling pressure brought to bear on RSX going into the election. This 3-day loss pales in comparison to the subsequent post-election gain. The afterglow of the election was so strong that in about 5 weeks, RSX’s post-election gain was 19.0%. RSX closed higher just one more time (January 27, 2017).
Russia’s well-being is of course highly dependent on oil prices. RSX rallied alongside a surge in oil prices and maxed out around the same time of oil. It just so happens that West Texas Intermediate now trades where it was on election day – very consistent with theme. Brent has not quite finished its Trump reversal.
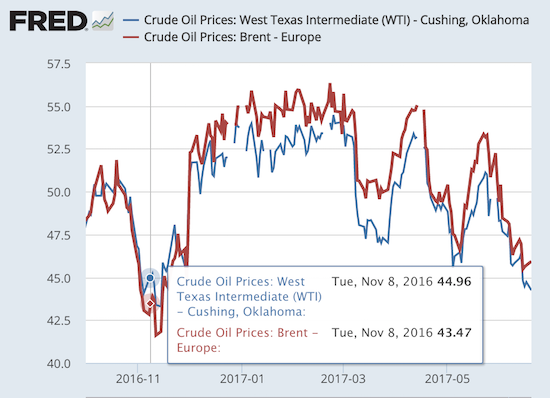
Oil mainly benefited from the Trump Trade in one short burst. Since early 2017, oil has traded lower in very choppy fashion.
Source: U.S. Energy Information Administration, Crude Oil Prices: West Texas Intermediate (WTI) – Cushing, Oklahoma [DCOILWTICO], retrieved from FRED, Federal Reserve Bank of St. Louis; June 22, 2017.
I note these reversals as confirming evidence that the Trump Trade has ended. Characterizing the market as a mix of Trump on/off trades has become more episodic than enduring (like the current rally in solar stocks based on Trump’s suggestion that his border wall could be funded by accompanying solar panels). In February, I observed an apparent shift in the nature of the Trump trade: more about volatility than sustained moves. The increasing number of sector-wide, not just stock-wise, reversals since then demonstrate the extent of the post-election over-reaction. This over-reaction was fueled in part by the excessive pessimism that went into the election, including the massive 10% or so drop in the S&P 500 futures after Trump was confirmed as the winner. That implosion was reversed by the time the U.S. stock market opened for trading on the first post-election morning.
While RSX traded down, I traded in and out of the Direxion Daily Russia Bear 3X ETF (RUSS) two or three times. However, I missed the latest rally (RSX sell-off). Even though RSX has broken down well below its 200-day moving average (DMA) (and RUSS has broken out above its 200DMA), I am loathe to chase here because oil in the low $40s “smells like” the vicinity of a bottom. RSX could rally sharply if oil shows any signs of a (relief?) rally. So, I prefer to wait for a lower-risk fade on RSX.
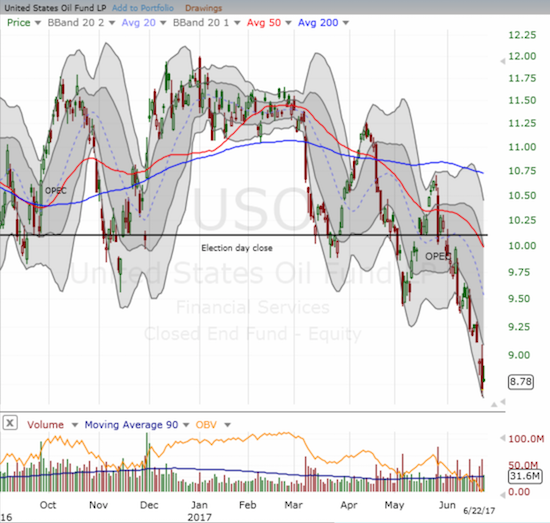
The United States Oil (USO) maxed out along with RSX – a confirmation of Russia’s on-going dependence on the fortunes of oil.
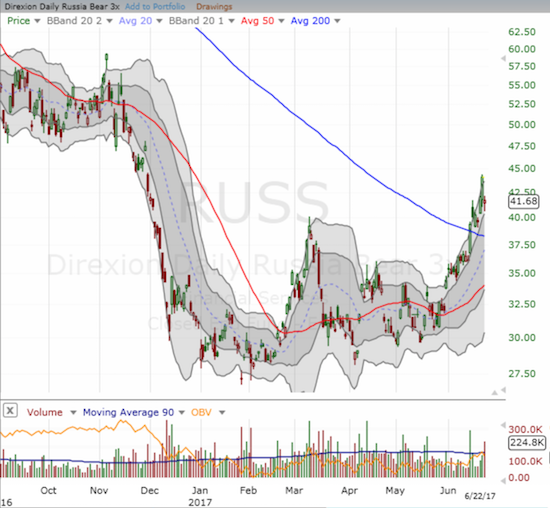
The 200DMA breakout for the Direxion Daily Russia Bear 3X ETF (RUSS) looks like the confirmation of a bottom.
Of course this all begs a question: do the major indices represent the last (and best) holdouts for the Trump Trade? Let’s hope not; if so, then the established pattern suggests the S&P 500 and the Nasdaq must also revisit their respective pre-election prices…
And for a little counterpoint, here is a chart of U.S. Concrete which broke out to a new all-time high.
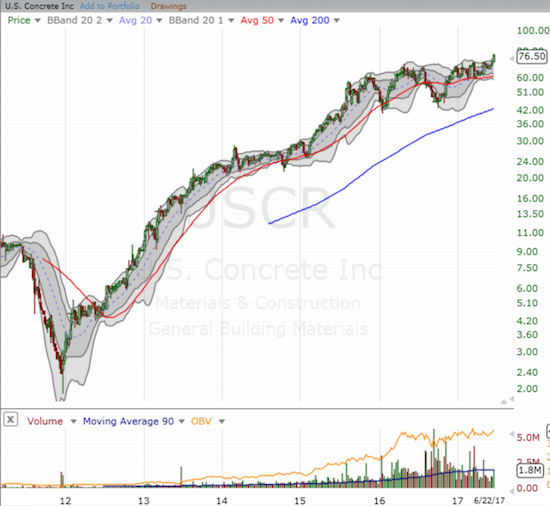
I never should have sold my small holding in U.S. Concrete (USCR). The post-recession run-up unfolded into a fresh breakout after two years of largely going nowhere.
Source: FreeStockCharts.com
Disclosure: Short USO put options.
Follow Dr. Duru’s commentary on financial markets via more


thanks dr guru