A Signal To Ignore?

Executive Summary:
With recent data showing the initial rebound in economic activity to be waning, the unprecedented level of support from the Fed and Washington takes on added importance. As such, the battle between the "real economy" and expectations for recovery is likely to continue. And so far at least, a "modern monetary theory" approach appears to be winning out. So, as I've been saying, I'm of the mind that investors should avoid "fighting the Fed" and stay seated on the bull train.
My Take on the State of the Fundamental Backdrop...
There is one change to report on the Fundamental Factors board this week as our Earnings composite slipped into the red. On the surface, this would seem to be a negative. However, in this case, where the economy - and in turn, earnings growth - was intentionally stopped and started within a short period of time, we have to recognize that our earnings models are lagging indicators.
The bottom line is I will argue that stocks initially dove on the expectations of an earnings collapse but have since moved on to discounting better days ahead. The question, of course, is if the anticipated improvement in the earnings will arrive in the time frame expected.

* Source: Ned Davis Research (NDR) as of the date of publication. Historical returns are hypothetical average annual performances calculated by NDR. Past performances do not guarantee future results or profitability - NOT INDIVIDUAL INVESTMENT ADVICE.
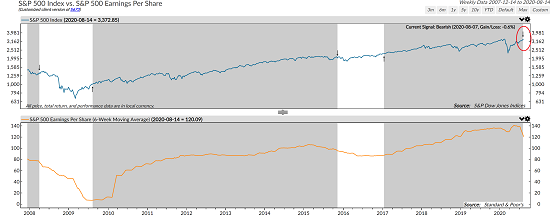
Below is the indicator that turned the Earnings composite negative. The top clip is the S&P 500 with the indicator's buy and sell signals. The bottom clip is a six-week moving average of the S&P's earnings per share.
S&P 500 Earnings Per Share

Source: Ned Davis Research Group
The indicator and buy/sell strategy was developed by Ned Davis Research Group and is based on the directional movement of earnings. A sell signal is triggered when the moving average of EPS falls by 10% from its high, which just occurred. And buy signals happen with the moving average moves up from its low by 1.5%
A review of the hypothetical record shows that this approach has been pretty good historically. For example, since late 1979, the S&P has hypothetically gained at a rate of 11.84% per year when on buy signals and lost ground at a rate of -5.9% when on sell signals (compare to the S&P's return of +8.9% over the same period).
My take is this indicator represents a strong approach to managing the downside risks associated with periods of falling earnings. When earnings are starting to fall, history shows that it's a good idea to play some defense. And then when earnings begin to rise, it's time to jump back on the bull bandwagon. Well, except for periods where the economy was shut down for a couple months to keep people healthy, that is.
So, since the current situation is unique and has never really happened before, I am taking the recent sell signal with a fairly large grain of salt.
Disclosure: At the time of publication, Mr. Moenning held long positions in the following securities mentioned: none - Note that positions may change at any time.
The opinions and forecasts ...
more


Be careful betting on the whole economy, without further stimulus and support for those displaced, economic activity should wane some more.