
There’s no economic news of significance until Wednesday’s report on existing home sales. But in the meantime, I’ve read a number of takes slicing and dicing last week’s inflation report that I thought missed the mark, so let me take the opportunity today and tomorrow to discuss the essence of the US’s consumer inflation situation.
Basically, it is almost *all* about shelter.
Take almost any of the graphs, charts, and commentary you’ve read about inflation in the past week, and they all boil down to one variable: if however, you slice and dice includes shelter, inflation is running too high. If it doesn’t include shelter, inflation is at or close to the Fed’s target.
That point is made by this first graph below, showing headline inflation (blue), shelter inflation (black), and inflation ex-shelter (red):
(Click on image to enlarge)

Inflation ex-shelter is currently 2.2% YoY. Even more importantly, it has been under 2.5% for the past 11 months, and under 2% for 9 of them. This is crucially important, and I’ll come back to this theme tomorrow.
Further, we know that shelter follows house prices with a 12 to 18 month lag. Here’s the latest update of the graph I’ve been running at least twice a month for almost 2 years now:
(Click on image to enlarge)

Obviously it’s not a perfect relationship. House price inflation rose - and has fallen - more sharply than CPI for shelter; and had a one year plateau that the CPI component did not. But almost certainly shelter inflation is going to continue to gradually decline for the near term future.
And even further, note that CPI ex shelter includes all the rest of our current problem children. For example, here is food away from home:
(Click on image to enlarge)

As I wrote last week, this issue appears to be fading, although it has a ways to go.
And the other big problem child is transportation services, which is primarily motor vehicle repairs and insurance, currently higher by 11.2% YoY. Here it is compared with new and used motor vehicle prices, both normed to 100 as of just before the pandemic:
(Click on image to enlarge)

As vehicle prices rose by over 25%, the cost of parts to repair vehicles, as well as insurance payments necessary to cover the cost of losses would normally increase by the same amount. And with a lag, they have (note that historically transportation services have risen faster than vehicle prices, as partially shown by the years leading up to the pandemic).
Much of the slicing and dicing I have seen in the commentary deals with inflation in the services component. As you can see below, inflation in both durable (-3.2% YoY) and non durable (+1.8%) goods has met the Fed’s target, while services (red, +5.2%) clearly has not:
(Click on image to enlarge)

But again, remember that shelter -surprisingly - is treated as a service rather than a good. So in the below graphs, I split out from total services (black) the subgroups of energy services (yellow), medical services (light blue), and transportation services (dark blue), as well as shelter (red). Here’s the post-pandemic look:
(Click on image to enlarge)

Both energy and medical services are relatively well-behaved. As shown above, transportation services are generally about insurance and repair costs catching up with the prior steep climb in vehicle prices. But most importantly, note that the red and black lines stay very close together. In other words, services inflation is primarily about shelter.
Here is the historical look, divided into two parts for better viewing:
(Click on image to enlarge)
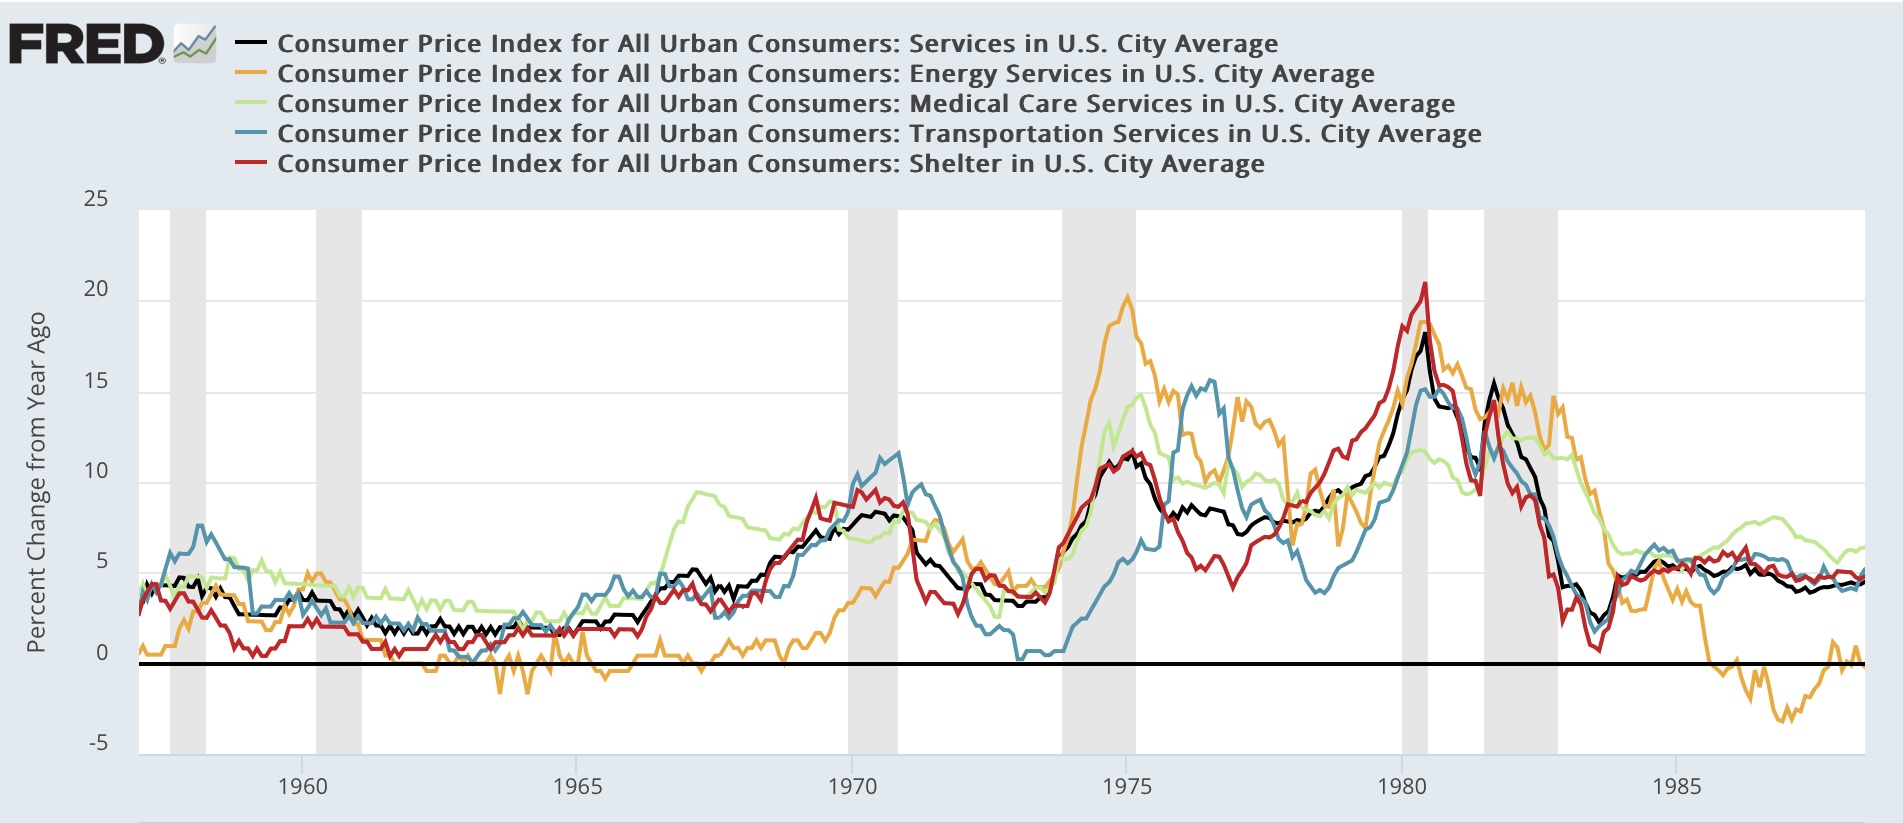

Note that services inflation has almost *always* tracked closely with shelter inflation. Note also the point that transportation services costs have frequently lagged the other measures, even shelter inflation, particularly as insurers raised rates for several years to make up for increased repair costs.
So, to recapitulate: while there remain several other problem children, when all the slicing and dicing is done, it depends upon whether your favorite slice includes shelter or not as to whether consumer inflation is close to or at the Fed’s target or not. And because shelter inflation lags house prices, it should continue to gradually decelerate from its still-lofty levels.
Which leads me to today’s final point. Below is a graph showing historically the net level of divergence between total headline inflation and shelter inflation. Currently shelter inflation YoY is 1.15% higher than headline inflation - one of the highest such divergences in history, and the longest such big divergence:
(Click on image to enlarge)

This is what I will be exploring tomorrow. And the Fed’s role in bringing about - and failing to resolve - this discrepancy.
More By This Author:
April Update: Real Wages, Payrolls, And Consumption Vs. Employment, And Their Forecast ImplicationsApril Housing: Uh-Oh, Housing Units Under Construction Has Stopped Levitating
Jobless Claims Still Positive


Comments
Log in or sign up to join the conversation.