
A Change In Focus?

Image Source: Pixabay
Let’s start with the good news. The panic brought on by the failure of Silicon Valley Bank, Signature, and more recently, the shotgun wedding between UBS and Credit Suisse has not produced a financial crisis, at least not yet. The bad news is that it could be the proverbial straw that breaks the camel’s back for economies in North America and Europe.
We’ve now likely reached the point that markets pivot from looking at the monthly CPI numbers to a broader set of data to determine their view of the world. Investors will be spending a lot of time in Q2 perusing data on lending, deposit flows, and credit standards for evidence that turmoil in the banking is driving tighter credit conditions and slower growth in the economy.
This then will also invite investors to look beyond inflation in forming their view on, and expectations for, monetary policy.
If we start by surveying the damage since Silicon Valley closed its doors, readers will be excused for asking what the commotion is all about. The benchmark global equity index was up slightly in March, and bond yields fell. What’s not to like? The first clue that markets have experienced significant dislocation recently is the surge in fixed income volatility.

Fig. 1 shows that the MOVE index has rocketed in the past month to levels not seen since the early stages of the financial crisis. Fig. 2 shows that the 1m/6m fixed income volatility curve inverted sharply in the past few weeks as the price of near-term volatility surged in a frenzy over wild speculation about the significance of the turmoil in the banking sector.
This shift in headline volatility indicators occurred in the context of what the FT’s Robin Wigglesworth calls “very” wild treasury trading in March. This is what happens when markets can’t make up their mind, and instead decide to extrapolate every bit of new information to either the end of the world or a continuation of the status quo of sticky inflation and rising policy rates.
For this reason, we still need to be careful in trying to pick out any signal from the noise in fixed income markets. But let’s try, all the same. Fig. 3 shows that two-year yields in the US, EZ, and UK are off their highs, indicating that markets have reduced their bets on the number of rate hikes compared to before the SVB failure.
We see the same sign in Eurodollar and Euribor futures. At end of April, EDZs were pricing in a Dec. 23 Fed funds rate of 5.5% at the beginning of March. This number has since declined to 4.5%, implying cuts between now and the end of the year, up from a trough of 4% at the height of the banking panic. In Europe, Euribors now see a policy rate of 3.5% at the end of the year, down from just over 4% at the end of February.
This would imply 50 bp more from the ECB in Q2, assuming the central bank front-loads any further hikes this year. The prospect of the ECB out-hiking the Fed in the second quarter is an important nuance, but in the grand scheme of things, these data tell a simpler story; they point to an imminent end to the interest rate hiking cycle in developed markets.
Looking further ahead, the Eurodollar and Euribor curve continue to signal that both the Fed and ECB will be cutting rates next year, by some 120 bp and 60 bp, respectively. For this message by fixed income markets to be even remotely plausible, two things will have to happen in the next three to six months.
First, the roll-over in inflation will have to continue, and secondly, investors and policymakers will have to begin to focus on a broader palette of (weakening) economic data to inform their views on the path of interest rates. I think both are a good bet, despite the fact that core inflation in Europe probably will be unpleasant enough to push the ECB to one or two more hikes in Q2.
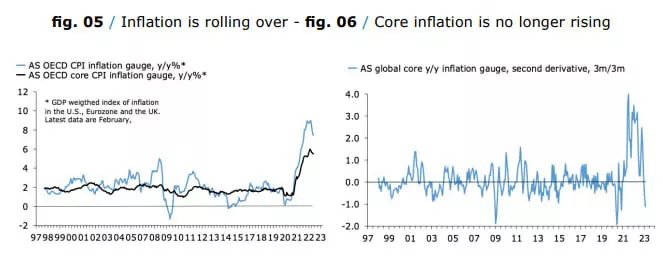
Fig. 5 shows that headline and core inflation in the US, UK, and the Eurozone are now rolling over. Fig. 6 confirms that core inflation is now decelerating, a sign that policymakers have been desperately searching for since they fatefully nailed their colors to the mast of transitory inflation.
Fig. 7 shows that surveyed selling prices in both services and manufacturing have softened, and fig. 8 shows that their combined message clearly suggests inflation will fall further. Assuming this is true, what will we be looking at in Q2? I can’t say for sure, but I think my final two charts are a good bet.
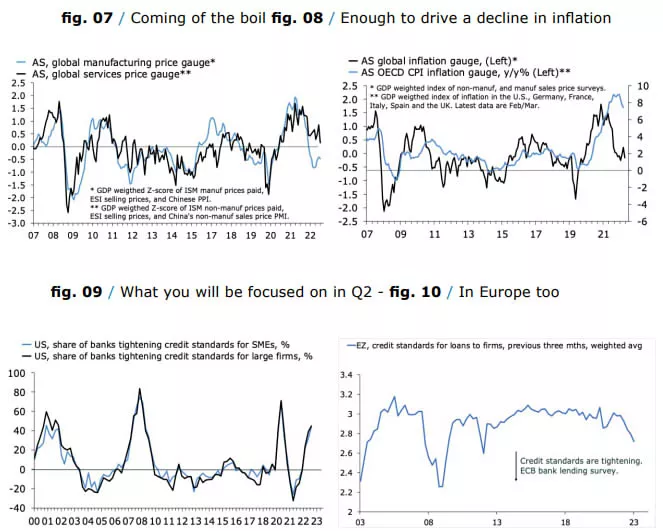
Fig. 9 shows the net share of banks in the US, as part of the Fed Loan Officer Survey, who tightened credit standards at the start of 2023, before the failure of Silicon Valley Bank, and fig. 10 plots a similar chart for banks in the euro area.
My guess is that investors and policymakers will be spending a lot of time in Q2 discussing and analyzing these charts, and others like them. Assuming that the picture from surveyed credit standards, deposit flows, and lending will look a lot worse for wear in the second quarter—and I think we can safely assume that—they should soon contribute to a change in focus for markets and policymakers alike.
More By This Author:
Systemic?At The Mercy Of Inflation
Spare A Thought
Articles linked in this text:


