
5% Months
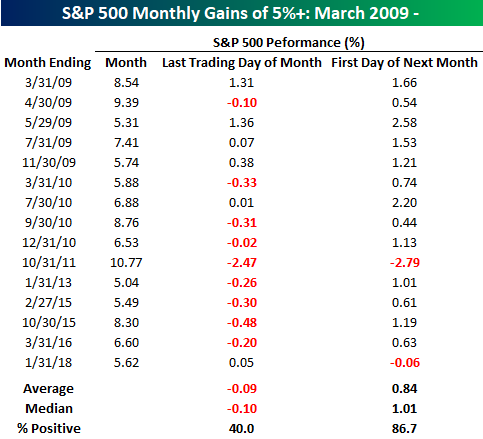
7%? Bulls will take it! After an abysmal December, the S&P 500 is currently set to finish the month with its best January return since 1987. This month’s gain will mark the 16th time since the lows of the Financial Crisis in March 2009 that the S&P 500 has rallied more than 5% in a given month. The table below highlights each of the 15 prior months where the S&P 500 rallied more than 5% and shows how much the S&P 500 gained on the month as well as its performance on the last trading day of the month and the first trading day of the subsequent month.
When looking at the table, a few things stand out. First, the first trading day of a month that follows a month where the S&P 500 rallied more than 5% has been extremely positive as the S&P 500 averages a gain of 0.84% (median: 1.01%) with positive returns 13 out of 15 times! In addition to the positive tendency of markets on the first day of the new month, there has also been a clear tendency for the S&P 500 to decline on the last trading day of the strong month. The average decline on the last trading day of a strong month has been 0.09% with positive returns less than half of the time. This is no doubt related to the fact that funds are forced to rebalance out of equities to get back inline with their benchmark weights. However, on those five prior months where the S&P 500 bucked the trend and was positive on the last trading day of a 5%+ month, the average gain on the first trading day of the next month was even stronger at 1.52% with gains five out of six times.
Disclaimer: To begin receiving both our technical and fundamental analysis of the natural gas market on a daily basis, and view our various models breaking down weather by natural gas demand ...
more

