5 Metrics To Watch As Stocks Make 2025 Debut

Image Source: Pexels
Sellers appear to be in control on Wall Street following a robust 2024. With many indicators at tipping points, now is a prime time for investors to refocus and monitor various market indicators. Below are five things equity investors should watch as 2025 kicks off on Wall Street:
Sentiment: Market Flashes Fear Signal
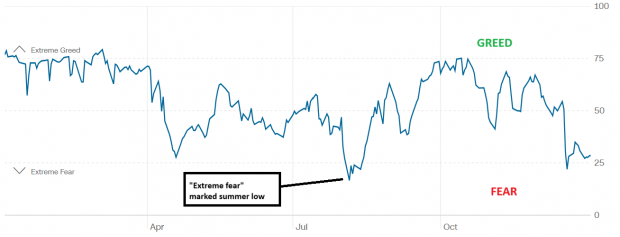
Bullish investors just enjoyed a banner year in US equities with the S&P 500 Index scoring gains of nearly 25% for 2024. Following the US presidential election, stocks soared and the S&P 500 Index printed an all-time high last month. However, investors may be surprised to observe that sentiment, as measured by the “CNN Fear and Greed Index,” plunged to the “Extreme Fear” level on December 19th after a relatively shallow, Federal Reserve-induced pullback in stocks.

I have observed that “Extreme Fear” readings in the CNN Fear and Greed Index can be a rare yet powerful bottoming indicator. Though sentiment is a secondary indicator, excessive fear can be a fantastic contrarian signal when used in conjunction with other market metrics.
The Intermediate Market Trend is Intact
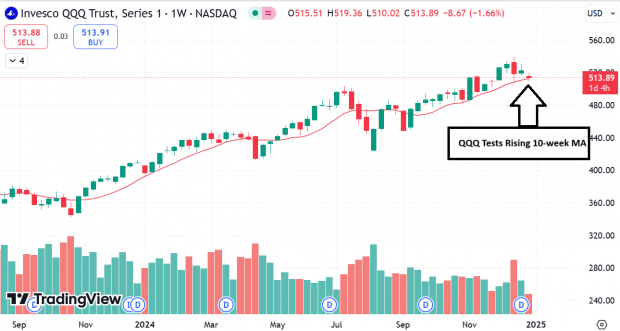
Unlike sentiment, price action is a “primary indicator.” The 10-week moving average is the optimal trend intermediate trend filter for savvy investors to watch. Tech stocks and the Nasdaq 100 Index ETF ((QQQ - Free Report) ) have been the leaders over the past few months, so they are the best market segment to watch. QQQ has trended above the 10-week MA since September and is currently testing the level again. If QQQ bulls can hold the 10-week MA, it will be evidence that the intermediate trend is intact.

Image Source: Zacks Investment Research
Small-cap Seasonality & “The January Effect”
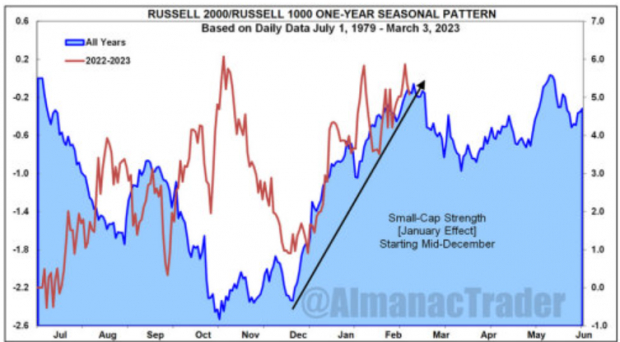
As measured by the Russell 2000 Index ETF ((IWM - Free Report) ), small-cap stocks drastically underperformed large-caps in 2024. Nevertheless, stubborn bulls may finally reap some rewards in January. Historically, small-caps perform the best in January. In addition, the beaten-down IWM is finding support near its rising 200-day moving average – a long-term support zone.

Image Source: (Jeffrey Hirsch, @almanactrader)
“Risk-On” Clues
Risk-on stocks such asRigetti Computing ((RGTI - Free Report) ), Intuitive Machines ((LUNR - Free Report) ), Unity Software ((U - Free Report) ) continue to find buyers – a bullish sign. However, investors should monitor the rising USD ETF ((UUP - Free Report) ), as a rising dollar can be a headwind for equities.
Poor End to Year is Not a Death Sentence
The ordinarily strong “Santa Rally” handed investors coal for Christmas, leading to three consecutive red sessions to close the year. Though it may seem counterintuitive to investors, a weak end to the year does not necessarily translate to a poor start to the year (at least according to the data). When the S&P 500 Index has declined three consecutive sessions to end the year (over the past 100 years), it has finished higher one week and one month later 100% of the time (5 instances).

Image Source: (@subuTrade, @RyanDetrick)
Bottom Line
After a robust 2024, sellers are back in control on Wall Street. Investors should observe the five indicators mentioned in this article to determine the next big market move.
More By This Author:
Expectations For Stock Market 2025: Read The 'January Barometer'
Bull Of The Day: GameStop
Quantum Stocks Are On Fire: Here's One To Watch
Disclosure: Zacks.com contains statements and statistics that have been obtained from sources believed to be reliable but are not guaranteed as to accuracy or completeness. References to any ...
more


