

Image Source: Pexels
GDP growth of 4.3% far exceeded the 3.3% consensus forecast. However, as a survivor of the 2001 “is it or not” recession debate*, I think it useful to consider the revisions that occur to GDP growth. Here’s a picture of levels of GDP for 2001, according to different vintages.
(Click on image to enlarge)

Figure 1: GDP in billions Ch. 1996$ SAAR. NBER defined peak and trough dates at dashed lines. 6/29/22 GDP calculated dividing nominal GDP by GDP deflator rescaled to 1996=100. Source: BEA via ALFRED, NBER, and author’s calculations.
While the mean revisions are typically close to zero, the mean absolute revisions from advance to third release are typically substantial, on the order of 0.65 ppts, and from advance to first annual revision at 0.94 ppts, and to latest about 1.29 ppts (red and brown boxes in Table 2 from BEA (2024) excerpt below).
(Click on image to enlarge)
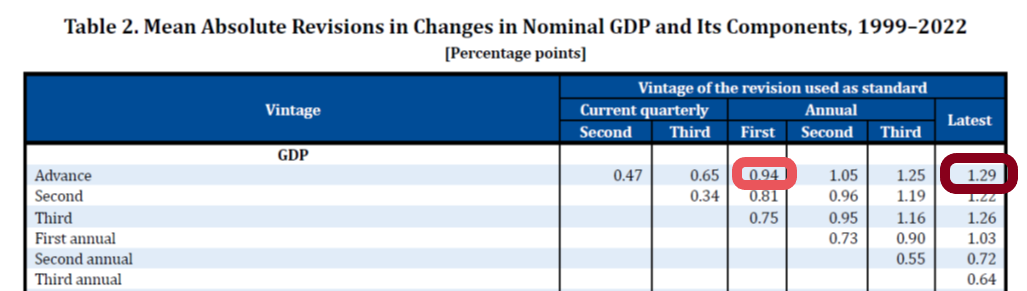
Source: BEA (2024).
In other words, it would not be statistically implausible for GDP growth to range between 3-5.6 ppts by the third release, and eventually 1.7-6.9 ppts (all figures annualized).
This is why in dating recessions, the NBER’s Business Cycle Dating Committee relies more on monthly indicators, and in particular employment and personal income ex-transfers, rather than on GDP. For a graphical depiction of these monthly indicators, see this post.
More By This Author:
A Holiday Memo: NBER BCDC And Alternative IndicatorsMore On The GDP Release: Compare against “Core GDP” And GDO
Good News From The GDP Report


Comments
Log in or sign up to join the conversation.