
1Q22 S&P 600 Earnings Estimates Tumble, Even As Sell-Side Optimism Increases For ’23!
Blended 1Q S&P 600 earnings estimates took a nosedive in the week to last Wednesday. This preceded a deteriorating profit trend among small businesses since last October. The Russell 2000 has tumbled nearly 26 percent the past six months. This probably prices in decent deceleration in the economy, but not contraction.

The ongoing 1Q22 earnings reporting season was a real setback in the latest week. In the week to last Wednesday, blended estimates for S&P 500/400/600 companies – large, mid- and small-cap – respectively dropped $1.31, $1.43 and $3.88 to $50.15, $39.63 and $16.47 from a week ago. At the end of the March quarter, the sell-side expected these companies to bring home $51.17, $40.86 and $20.15, in that order.
The collapse in 1Q small-cap earnings estimates in particular is noteworthy (Chart 1). With the latest drop, estimates are now at a one-year low. Analysts view last week’s collapse as a one-off. They concurrently raised their numbers for each of the next seven quarters through the end of 2023.
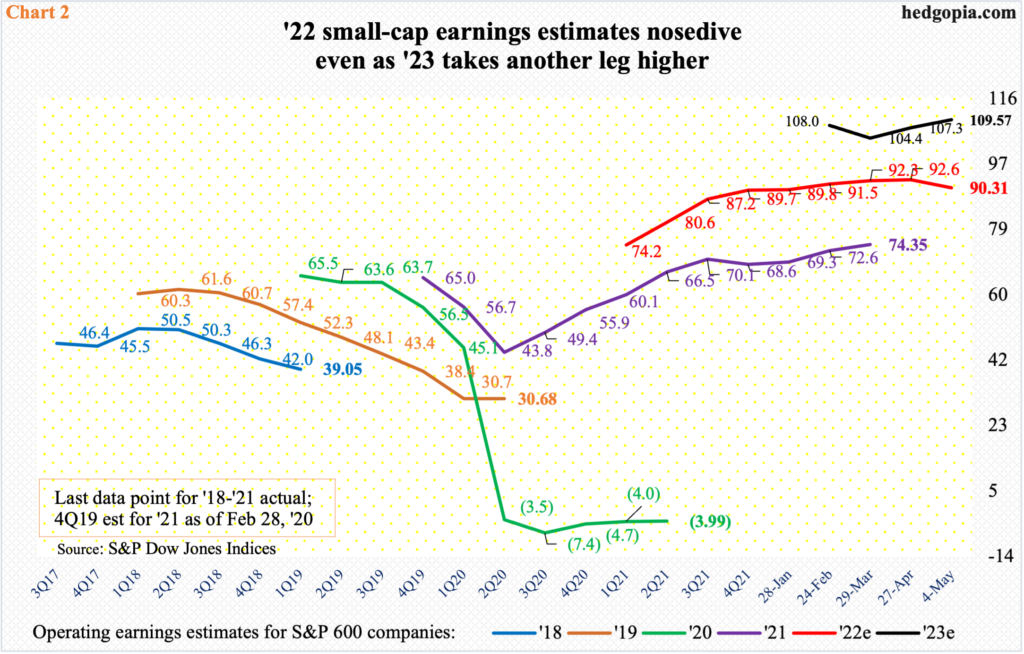
The plunge in S&P 600 1Q estimates obviously has hurt 2022 estimates, which fell $2.33 to $90.31. As recently as a month ago, these companies were expected to ring up $92.70. The revision trend has now decidedly shifted downward. The irony is, the optimism around 2023 estimates has gone the other way (Chart 2).
Next year, the sell-side now expects $109.57 – a new high. If earnings come through, they will have grown 21.3 percent over this year. This optimism is coming at a time when the Fed is aggressively raising its benchmark rates and there already are signs of growth deceleration – if not outright contraction – in the coming quarters.
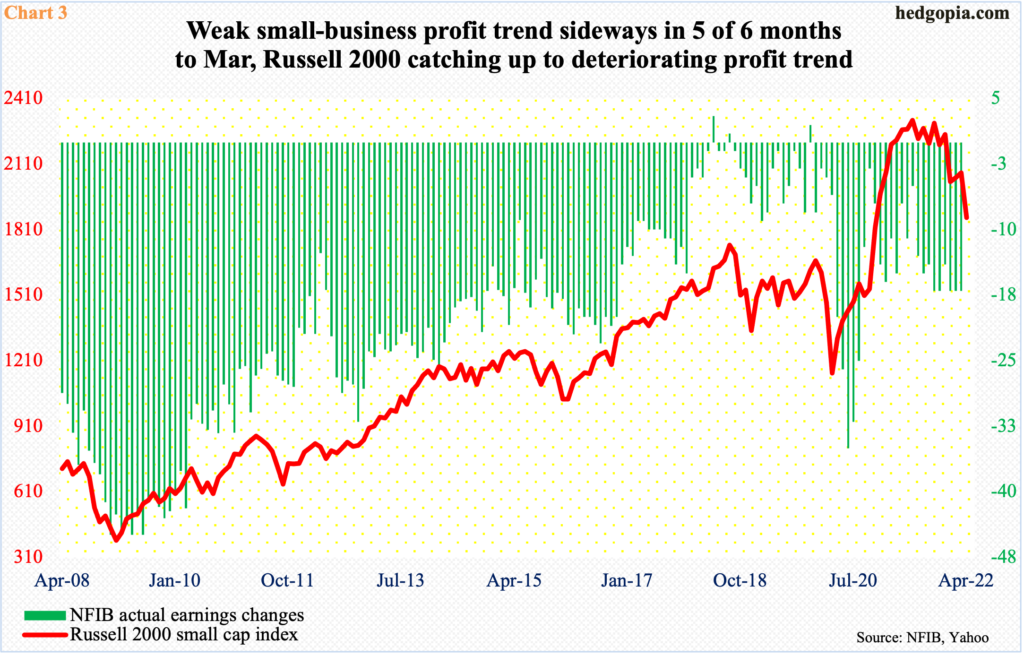
Interestingly, the National Federation of Independent Business’ monthly survey of small-business profit trend already showed a deteriorating trend.
Last June, the ‘actual earnings changes’ sub-index within the NFIB optimism index stood at minus five. It then persistently rose, reaching minus 17 in October, which was a 14-month high. In four of the next five months through March this year, the green histograms in Chart 3 went sideways at 17. This is a small consolation for small-cap optimists but at the same time the sideways action is taking place at an elevated territory.
Last year, a month after the ‘actual earnings changes’ sub-index hit minus 17 in October, the Russell 2000 peaked and has been in a downtrend trend since.
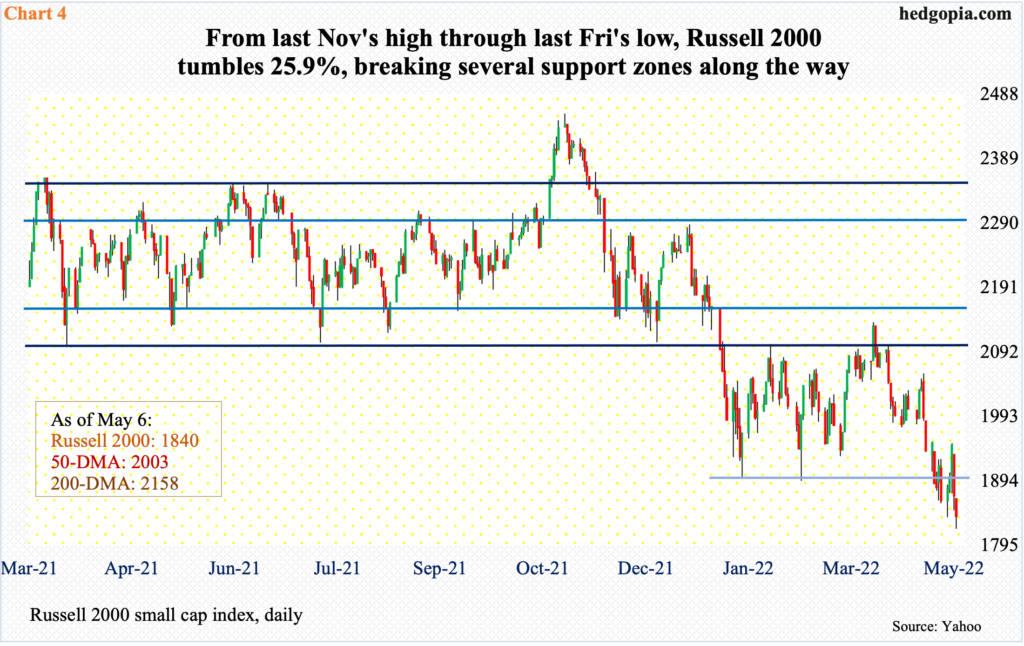
The Russell 2000 peaked at 2459 on November 8 last year. From that high through last Friday’s intraday low of 1821, the small cap index tumbled 25.9 percent, breaking several supports along the way.
Mid-January, the index suffered a rectangle breakdown. From March last year through January, the Russell 2000 remained rangebound between 2350s and 2080s, and between 2280s and 2150s within this box. On Nov 3, the index broke out but the momentum did not last; this was quickly followed by a failed retest on the 19th that month. Then came the mid-January breakdown (Chart 4).
After that, the Russell 2000 found itself caught in another range – this time between 2080s and 1900, which was hit twice in late January and late February. Late last month, even this gave way.
Last week, the index ranged from up 4.8 percent at Wednesday’s high to down 2.3 percent at Friday’s low, ending the week down 1.3 percent. In four of the five sessions, the small cap index (1840) closed under 1900, which obviously needs to be reclaimed for any momentum near term. Conditions are way oversold on nearly all timeframes.
Small-caps are also the ones with the largest exposure to the domestic economy. How they fare can have a wider meaning macro-wise. The six-month, 25.9-percent drop has understandably priced in plenty of deceleration in growth, but definitely not contraction in the economy. This also applies to the sell-side, whose optimism around small-cap earnings prospects for 2023 has gone up, not down. This is a potential problem down the line as these estimates get revised downward. Immediately ahead, unwinding of the oversold conditions the index is in is always possible.
Thanks for reading!


