
US Equity Markets Enter Q4 In Neutral Territory
Below is a snapshot of US equity index ETFs. The Trend Analyzer helps investors easily see where a large number of stocks or ETFs are trading relative to their normal ranges. When looking at the “Trading Range” section, the black, vertical line represents each ETF’s 50-day moving average, and the dot represents where the ETF’s price is currently trading. The tail end of the dot shows where the ETF was trading one week ago, so if the dot is to the left of the tail, the ETF’s price moved lower within its trading range over the last week.
Over the last week, every major US equity index ETF moved lower within its range with the exception of the Dow 30 (DIA). The small-cap Russell 2,000 (IWM) and the Micro-Cap ETF (IWC) both moved back below their 50-day moving averages, while the Nasdaq 100 (QQQ) is the next closest to testing its 50-DMA.
(Click on image to enlarge)

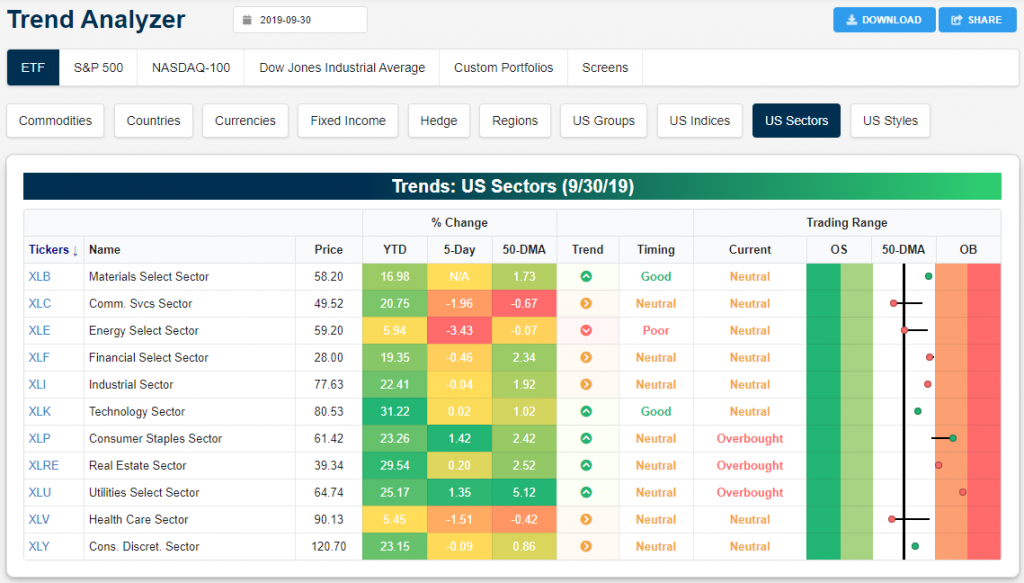
Looking at US sector ETFs, we saw Communication Services (XLC), Energy (XLE), and Health Care (XLV) break below their 50-day moving averages over the last week, while Consumer Staples (XLP) moved from neutral to overbought. Along with Utilities (XLU) and Real Estate (XLRE), the only sectors that are overbought right now are defensive in nature.
(Click on image to enlarge)
Start a two-week free trial to Bespoke Institutional for full access to our more


