
Two Pictures – Money To Income And The Price Level
Consider the following graphs. Figure 1 is M1 and M2 to real GDP (0.80 means 80%) for the United States. Figure 2 is M1 to real GDP on left scale, and CPI-all urban on the right scale (taking on a value of 100 in the period 1982-84).
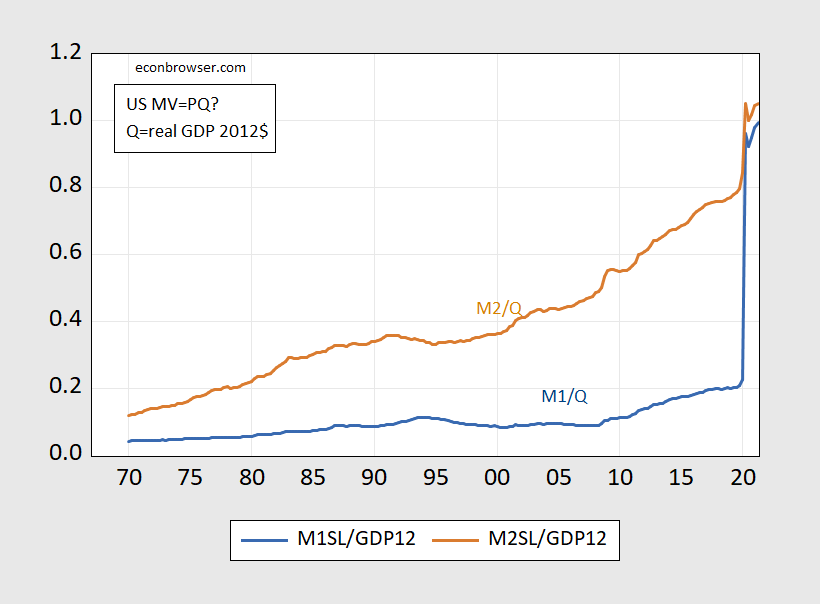
Figure 1: M1 in billions of $ divided by real GDP in billions of Chained 2012$, Seasonally Adjusted at Annual Rates (SAAR) (blue), and M2 divided by real GDP (brown). Money is seasonally adjusted, end-of-quarter figures. Source: Federal Reserve via FRED, BEA, and author’s calculations.
Is this picture cause for worry, in terms of inflation? Can you explain why you think it is, or is not? Now consider this graph.
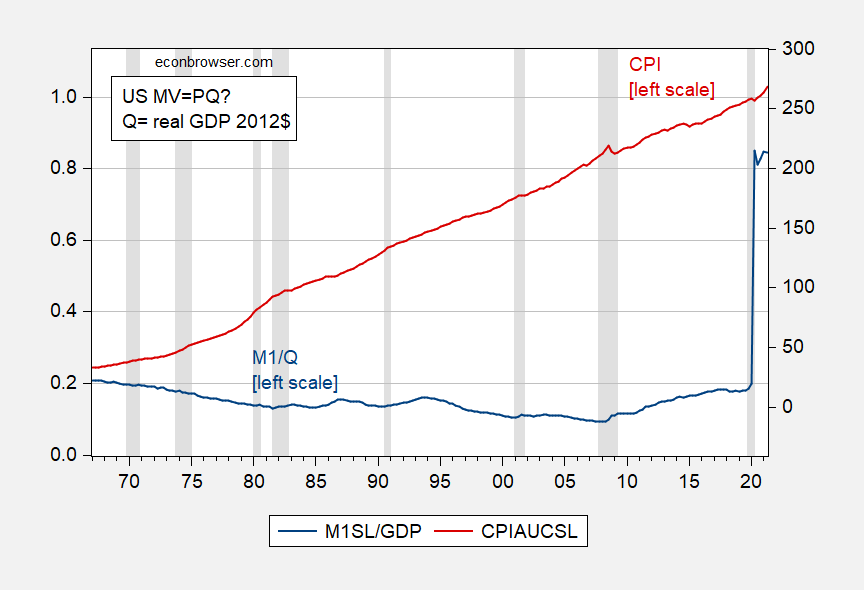
Figure 2: M1 in billions of $ divided by real GDP in billions of Chained 2012$, Seasonally Adjusted at Annual Rates (SAAR) (blue, left scale), and Consumer Price Index for all urban consumers (red, right scale). NBER defined recession dates shaded gray. Money is seasonally adjusted, end-of-quarter figures; CPI is average of monthly data. Source: Federal Reserve via FRED, BEA, and author’s calculations.
Does this picture change your views? Why, or why not?
Disclosure: None.


