
This Week's CoT, With Futures Positions Of Non-Commercials
Following futures positions of non-commercials are as of October 8, 2019.
10-year note: Currently net short 122.6k, down 41.1k.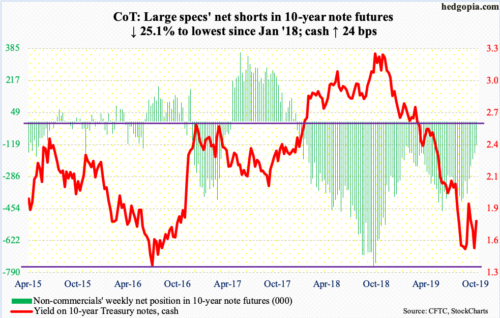
The 10-year Treasury yield (1.75 percent) put in a higher low. On September 3, rates fell to 1.43 percent, which was the lowest since the all-time low of 1.34 percent set in July 2016. Tuesday, the 10-year dropped to 1.51 percent before rallying. By Friday, it had reclaimed the 50-day at 1.64 percent. Before this, the average resisted rally attempts for nearly a year.
In October last year, the 10-year peaked at 3.25 percent, before proceeding to getting more than cut in half. In the meantime, TLT (iShares 20+ year Treasury bond ETF) rallied from $111.90 last October through $148.90 in August. (Yields and prices move in opposite directions.) Shorts probably played a role in this.
In September last year, non-commercials were net short 756,316 contracts in 10-year note futures – a record. As yields peaked shortly thereafter, and bond prices rose, short squeeze followed. By January this year, these holdings were down to 125,752 contracts. This week, these traders were net short 122,560 contracts. The potential fuel for squeeze has decreased significantly. Is this getting close to a washout? It is too soon to declare that. When the next recession hits, rates could very well make new lows. That said, bond bears (on price) should view the decline in net commercials’ net shorts positively – duration notwithstanding.
This week, the 10-year rallied 24 basis points, and has room to rally near term.
30-year bond: Currently net short 76.7k, up 4.7k.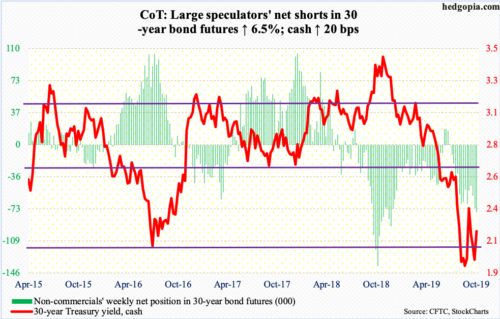
Major economic releases next week are as follows.
Retail sales (September), the NAHB housing market index (October) and Treasury International Capital data (August) will be out Wednesday.
Retail sales rose 4.1 percent year-over-year in August to a seasonally adjusted annual rate of $526.1 billion.
Home builder sentiment inched up a point month-over-month in September to 68. The cycle high 74 was reached in December 2017.
In the 12 months to July, foreigners sold $97.6 billion in US stocks. This is massive improvement in that in April they were selling $214.6 billion worth – a record.
Housing starts (September) and industrial production (September) are due out Thursday.
August starts dropped four percent m/m to 1.19 million units (SAAR). The cycle high 1.34 million was reached in January last year.
Capacity utilization in August fell 1.8 percent y/y to 77.9 percent. Last November’s 79.6 percent was the highest since May 2008.
WTI crude oil: Currently net long 522.8k, down 23.7k.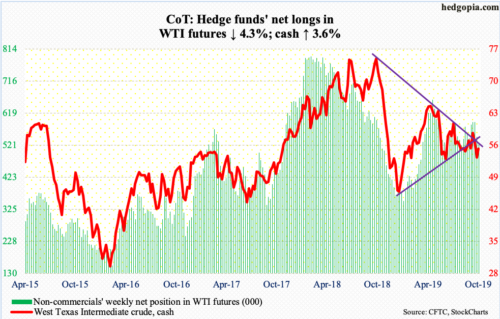
In the first four sessions this week, the cash ($54.70/barrel) pretty much went sideways just above support at $50-51. Friday, it rallied 2.2 percent. Shorter-term averages are trying to stabilize. Odds favor continued unwinding of daily oversold conditions. The underside of a broken trend line from last December lies at $56, which is about where the 50- and 200-day rest ($55.39 and $56.76, in that order).
The EIA report for the week of October 4 showed US crude production rose 200,000 barrels per day to 12.6 million bpd – a new record. Crude stocks rose 2.9 million barrels to 425.6 million barrels. Refinery utilization fell seven-tenths of a percentage point to 85.7 percent. In contrast, stocks of gasoline and distillates dropped 1.2 million barrels and 3.9 million barrels to 228.8 million barrels and 127.3 million barrels respectively. Crude imports fell 67,000 bpd to 6.2 mbpd.
E-mini S&P 500: Currently net long 54.1k, up 44.7k.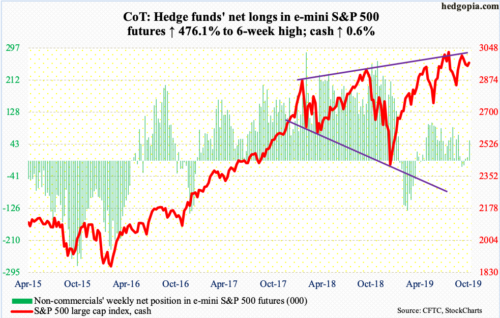
For the second week running, selloff in the first half of the week was bought hand over fist. Kind of. By Tuesday, the cash (2970.27) was down to 2892.66 intraday. Then, bids appeared. By Friday, the S&P 500 had recaptured the 50-day (2935.67) as well as 2940s. In fact, the average is now trying to go flat, even as the 200-day (2853.51) is rising. If bulls are unable to wrest control of momentum soon, a death cross is a risk in the next several weeks. This week’s action should buoy sentiment, although Friday’s 1.1-percent jump also came with a daily shooting star. Immediately ahead, bulls must be eyeing 3020s. Improvement in flows will help.
In the week to Wednesday, US-based equity funds lost $6.9 billion (courtesy of Lipper). In the same week, SPY (SPDR S&P 500 ETF), VOO (Vanguard S&P 500 ETF) and IVV (iShares Core S&P 500 ETF) lost a combined $6.4 billion (courtesy of ETF.com).
Euro: Currently net short 75.4k, up 9.4k.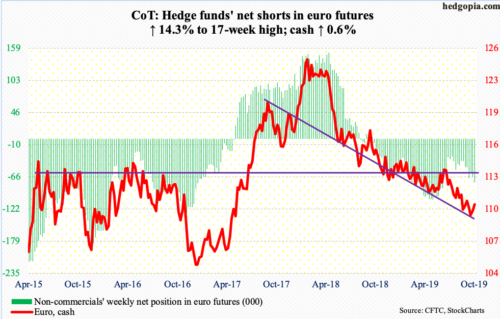
Twice last week, the cash ($110.43) made an intraday low of $108.85, which was the lowest since May 2017. Rally attempts since were stopped at the 20-day, which was reclaimed Thursday this week. For a couple of months now, bulls were denied at horizontal resistance just north of $110, which gave way Friday. The next battleground lies at the 50-day ($110.52), which is trying to at least flatten out.
Gold: Currently net long 275.6k, up 6.6k.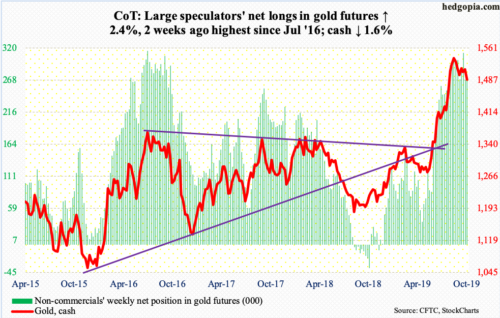
For the second week running, the cash ($1,488.70/ounce) pretty much straddled the 50-day ($1,514.31) before losing 0.8 percent Friday. Nine sessions ago, gold dropped to $1,465 intraday, which was nearly a successful breakout retest of $1,440s-50s. The way the metal is acting, another retest is imminent. The weekly is overbought, with a potentially bearish MACD cross-under this week.
In the week to Wednesday GLD (SPDR Gold ETF) absolutely saw no activity. IAU (iShares Gold Trust), on the other hand, drew $389 million (courtesy of ETF.com).
Nasdaq 100 index (mini): Currently net long 18.1k, down 8.7k.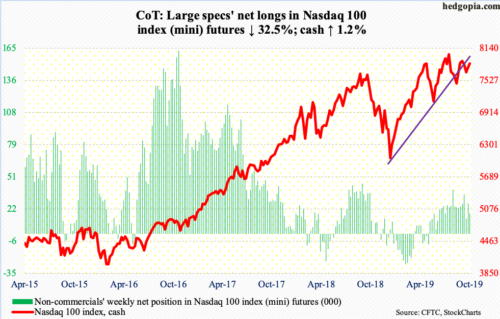
After losing $1.8 billion in the prior week, QQQ (Invesco QQQ Trust) lost another $957 million in the week to Wednesday (courtesy of ETF.com).
The cash (7843.88) came under pressure early in the week, but buyers showed up in the latter sessions. Thursday, bulls went after, but were unable to convincingly recapture, 7750, which represents horizontal resistance as well as the now-broken trend line from last December. This ceiling gave way Friday; bulls would have liked to end the session stronger, as they were unable to hang on all the gains, ending with a shooting star. Nearest resistance lies at 7925, which is where a trend line from July extends to. Friday’s intraday high was 7904.05.
Russell 2000 mini-index: Currently net short 41.4k, up 17.9k.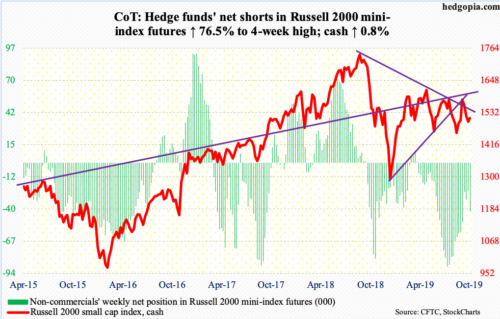
After a three-week selloff beginning mid-September, small-cap bulls are trying to form a base. Odds of that occurring are decent as long as the cash (1511.90) does not undercut two-year support at 1450s. This level was defended in early June, several more times in August and early this month.
This week, bulls managed to shake off early weakness to end on a strong note, up 0.8 percent. They would have liked a stronger end, but that was not to be. The Russell 2000 Friday was rejected at the 200-day (1526.98), ending the session right on the 50-day (1512.48).
In the week to Wednesday, $935 million and $18 million came out of IWM (iShares Russell 2000 ETF) and IJR (iShares Core S&P Small-Cap ETF) respectively (courtesy of ETF.com).
US Dollar Index: Currently net long 39.9k, down 3.2k.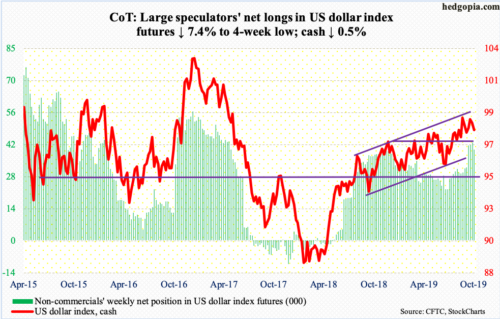
A month ago, the cash (98) was repelled at the upper bound of a one-year rising channel. This resistance, which again posed as a roadblock early this month, now lies at 99.50s. It increasingly feels like this ceiling is holding – at least for now. The lower bound of the channel rests at 96. That said, there is plenty of support before this gets tested, including 97.50s and the 50- and 200-day (98.17 and 97.02 respectively).
VIX: Currently net short 138.7k, down 16.2k.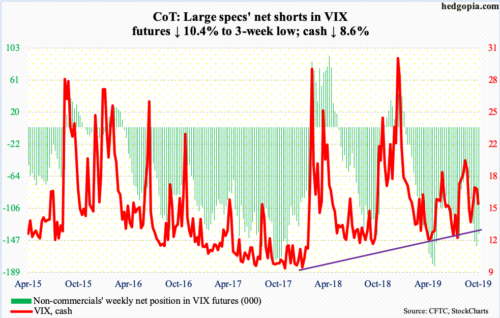
On the daily, the cash (15.58) has room to head lower. Tuesday’s intraday high of 20.38 did not even surpass the October 2nd high of 21.46, let alone the August 5th high of 24.81. Friday, both the 50- and 200-day (17.52 and 16.16 respectively) were lost.
In the meantime, the 21-day moving average of the CBOE equity-only put-to-call ratio ended the week at 0.686, down from Thursday’s 0.689. On September 24, it bottomed at 0.632. Historically, the ratio tends to peak at high 0.60s to low 0.70s. On August 23, it retreated after tagging 0.733, which laid the foundation for the rally in the S&P 500 from late August to the middle of September.


