
These Two Charts Show Exactly How BLS Suppresses CPI
This chart shows how much the BLS suppresses rent inflation in its CPI measure. It’s a major tool the government uses to suppress CPI.
A problem with the economic establishment’s focus on the CPI to measure “inflation” is that the CPI was never intended to measure “inflation” per se. Its purpose has always been to index government benefits, salaries, and contracts. The goal is to keep costs down by manipulating index to increase at the lowest possible rate that the BLS can present to the public with a straight face and the pretense of statistical accuracy.
The biggest tool that the BLS gives for manipulating CPI is the idea that housing prices do not count toward inflation because houses are assets, not consumption goods. Apparently the rationale is that assets don’t “inflate,” they “appreciate.” The BLS historically included house prices in CPI, but that became problematic because they were increasing too fast, pushing CPI up at a rate which the government simply could not afford. So the BLS stopped including house prices in CPI in 1982 after a couple of years of double-digit increases in CPI. In the place of actual housing inflation, the BLS substituted a made-up number called Owner’s Equivalent Rent (OER) .
The BLS starts with a survey of renters re how much rent they are currently paying. That becomes the basis for a line item in the CPI called Rent of Primary Residence. The BLS uses that item as a basis for annually benchmarking OER. Then they ask a tiny sample of homeowners how much they think their house would rent for. The BLS uses that survey of owners to estimate the rate of increase in OER, between the benchmark rent surveys. This method of “measuring” rent increases has consistently and systematically suppressed the recognition of the actual inflation rate of rent.
Liquidity moves markets!
Click here to learn how you can follow the money.
Anyone who spent half their life in the real estate business and anyone who has ever rented an apartment for a few years and then moved to another apartment, knows well that rent after a couple of years living in the same place is not the same as what the rent would be if they were moving to a comparable apartment.
The rent you are paying after you have lived in a place for a few years is set by the initial lease. It’s called “contract rent.” In most markets, especially in large cities with rent controls, landlords typically only bump your rent at lease renewal by 2-3% or by indexing rent increases to CPI, which in recent years has been below 2%. So the amount of rent you pay at lease renewal tends to increase by no more than 2-3%. Given the heavy weight of housing cost in CPI and the fact that standard rent renewal escalators are structured to mimic CPI, the process is circular and self reinforcing. It has nothing to do with the actual inflation rate of rents in the market.
Real estate professionals call that “market rent.” The change in market rent is the true measure of inflation. In the tight US rental market of the past couple of years, increases have typically run in the +4-6% range and occasionally higher, although they have cooled in 2015.
When you as a tenant live in apartment for 3 years, on average you would have seen a total rent increase of no more than 8-9%, which is the amount that shows up in the BLS Index of Rent of Primary Residence. But if you go into the marketplace to rent a comparable apartment, you are hit with an increase of around 15%. The BLS makes no attempt to recognize market reality. Why would it? Its job is to help save the government money on annual indexing of government payments. On the other hand, are there prices of any other product or service in the CPI which the government doesn’t measure in the marketplace every month? Their handling of the housing component of CPI sticks out like a sore thumb.
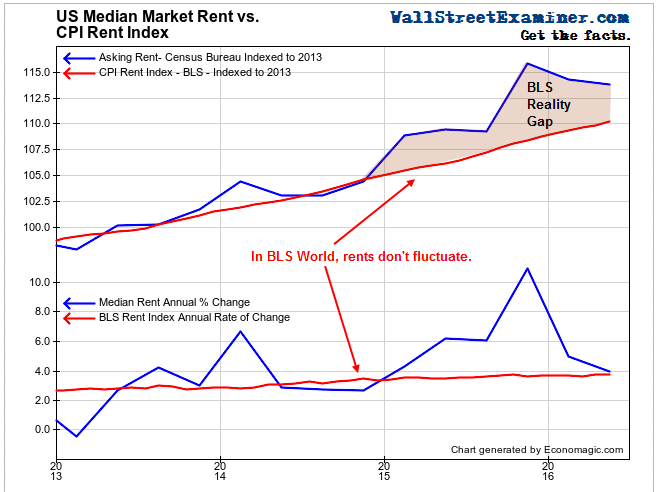
Another government agency, the Census Bureau, actually does survey the apartment rental market quarterly. The Bureau asks property owners what their asking rents are. In almost all markets, most of the time asking rent is synonymous with market rent. This has particularly been the case in recent years when the apartment rental market has tightened considerably in most US metros.
Lo and behold, in the Census Bureau survey we see a very different pattern of rent increases than what the BLS shows. It’s a pattern which all apartment renters would recognize. Rent increases fluctuate. They’re almost always in a rising trend, but sometimes they go up faster than trend and sometimes slower. Apparently the BLS doesn’t see it that way.
That’s right, in BLS World, rents rise in a perfectly straight line, accelerating at a perfectly exponential rate. Anything is possible in BLS world. You merely need to suspend disbelief, which economists and the mainstream financial media are always all too willing to do.
Now that rent increases have come back to earth a little here in mid 2016, the difference between how the BLS conjures up straight line rent growth and the real behavior of rent increases in the marketplace may not seem like a big deal. But in spite of actual rent increases slowing since late 2015, the Census Bureau’s rent index is still roughly 3.75% higher than the BLS rent index. That equates with the BLS understating rent inflation by an average of 2.5% per year.
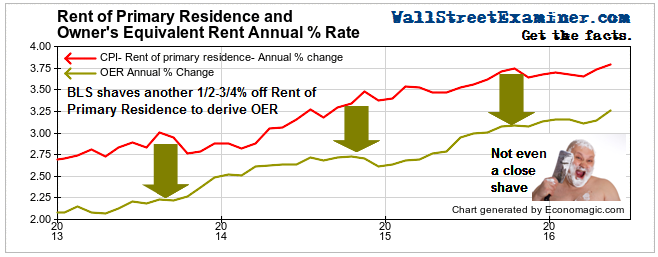
As if the BLS hasn’t gone far enough, in constructing OER it somehow manages to shave another half percentage point off Rent of Primary Residence. Apparently homeowners think that their imaginary rent is inflating slower than renters’ contract rents. The degree of detail that homeowners know about the rental value of their own homes is truly amazing. Apparently, we are all experts on the rental market in our neighborhood.
Admittedly that only shaves another tenth or so off the rate of increase, but really BLS people, haven’t you suppressed this number enough already?
Click here to view chart if reading in email.
Rent of Primary residence plus OER is by far the heaviest weight in CPI at 32% of total CPI. The Fed relies on “core” measures, excluding food and energy, in assessing whether “inflation” has reached its target. Rent of Primary Residence plus OER constitutes 40% of Core CPI. It follows that by understating rent increases by 2.5 to 2.6%, the BLS understates core CPI by at least a full percentage point each year. If the BLS or the Fed, or any mainstream journalist, were seriously interested in actually measuring inflation, then everyone would have recognized that it has been well above the Fed’s target of 2% all along.
more


Great and informative article covering the nuances of one factor that artificially affects CPI readings and why. Sadly the rise in housing prices and rent adversely affects growth by destroying household disposable income and making people move to smaller and smaller accommodations. Fortunately, the effects of QE and zirp policy hasn't gone on for over a decade like Japan where some now rent coffin sized sleeping quarters when traveling, although living space is already shrinking.
The Federal Reserve's insistence on pumping asset prices with zirp and QE has unintended consequences, only in so much as if they haven't seen what it did to Japan. Wake up America. This policy is destroying America's vibrancy even though on the surface it looks good in the short run. It is encouraging unsustainable debt, asset prices, and business decisions that are by nature anti-growth.