The Shifting Distribution Of Income In The United States
How has the cumulative distribution of income in the United States changed over the last six years?
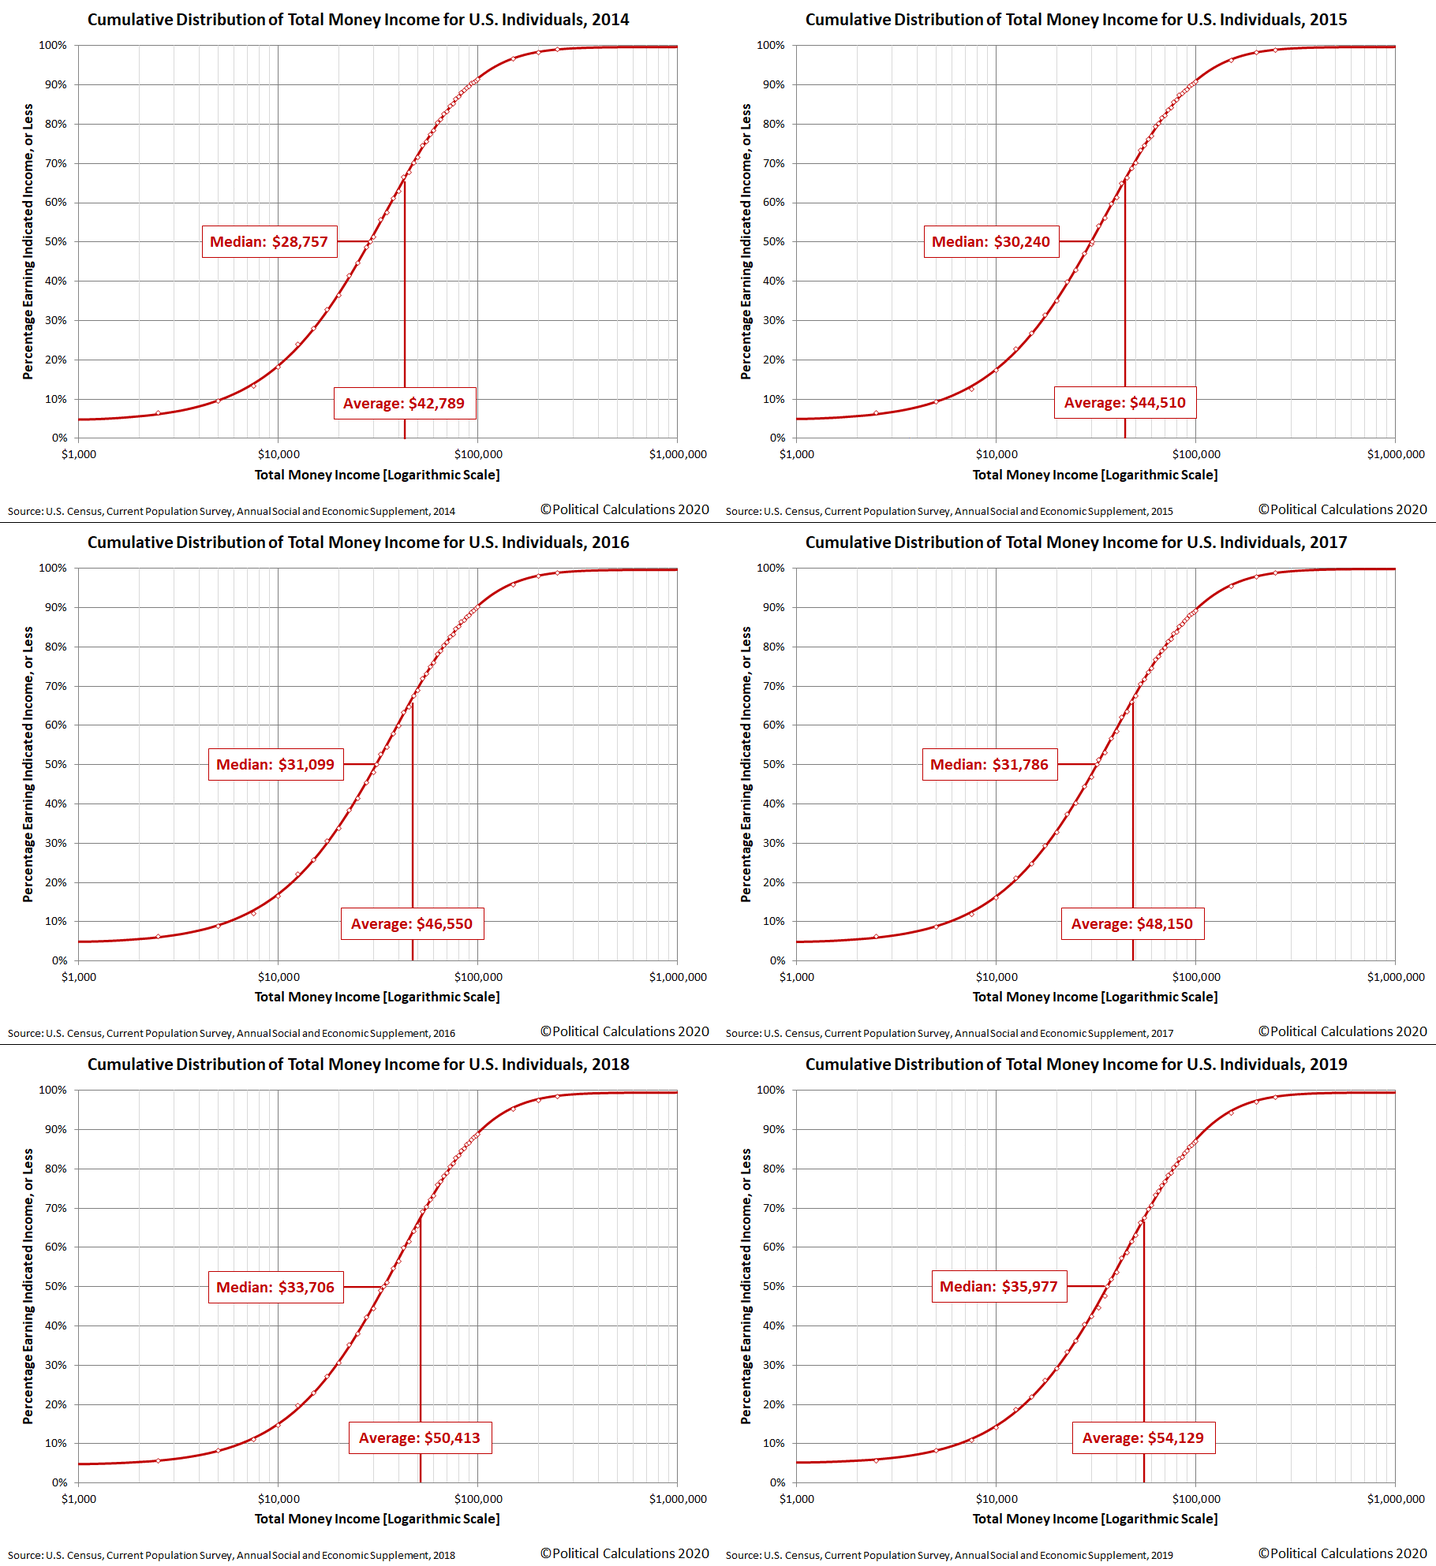
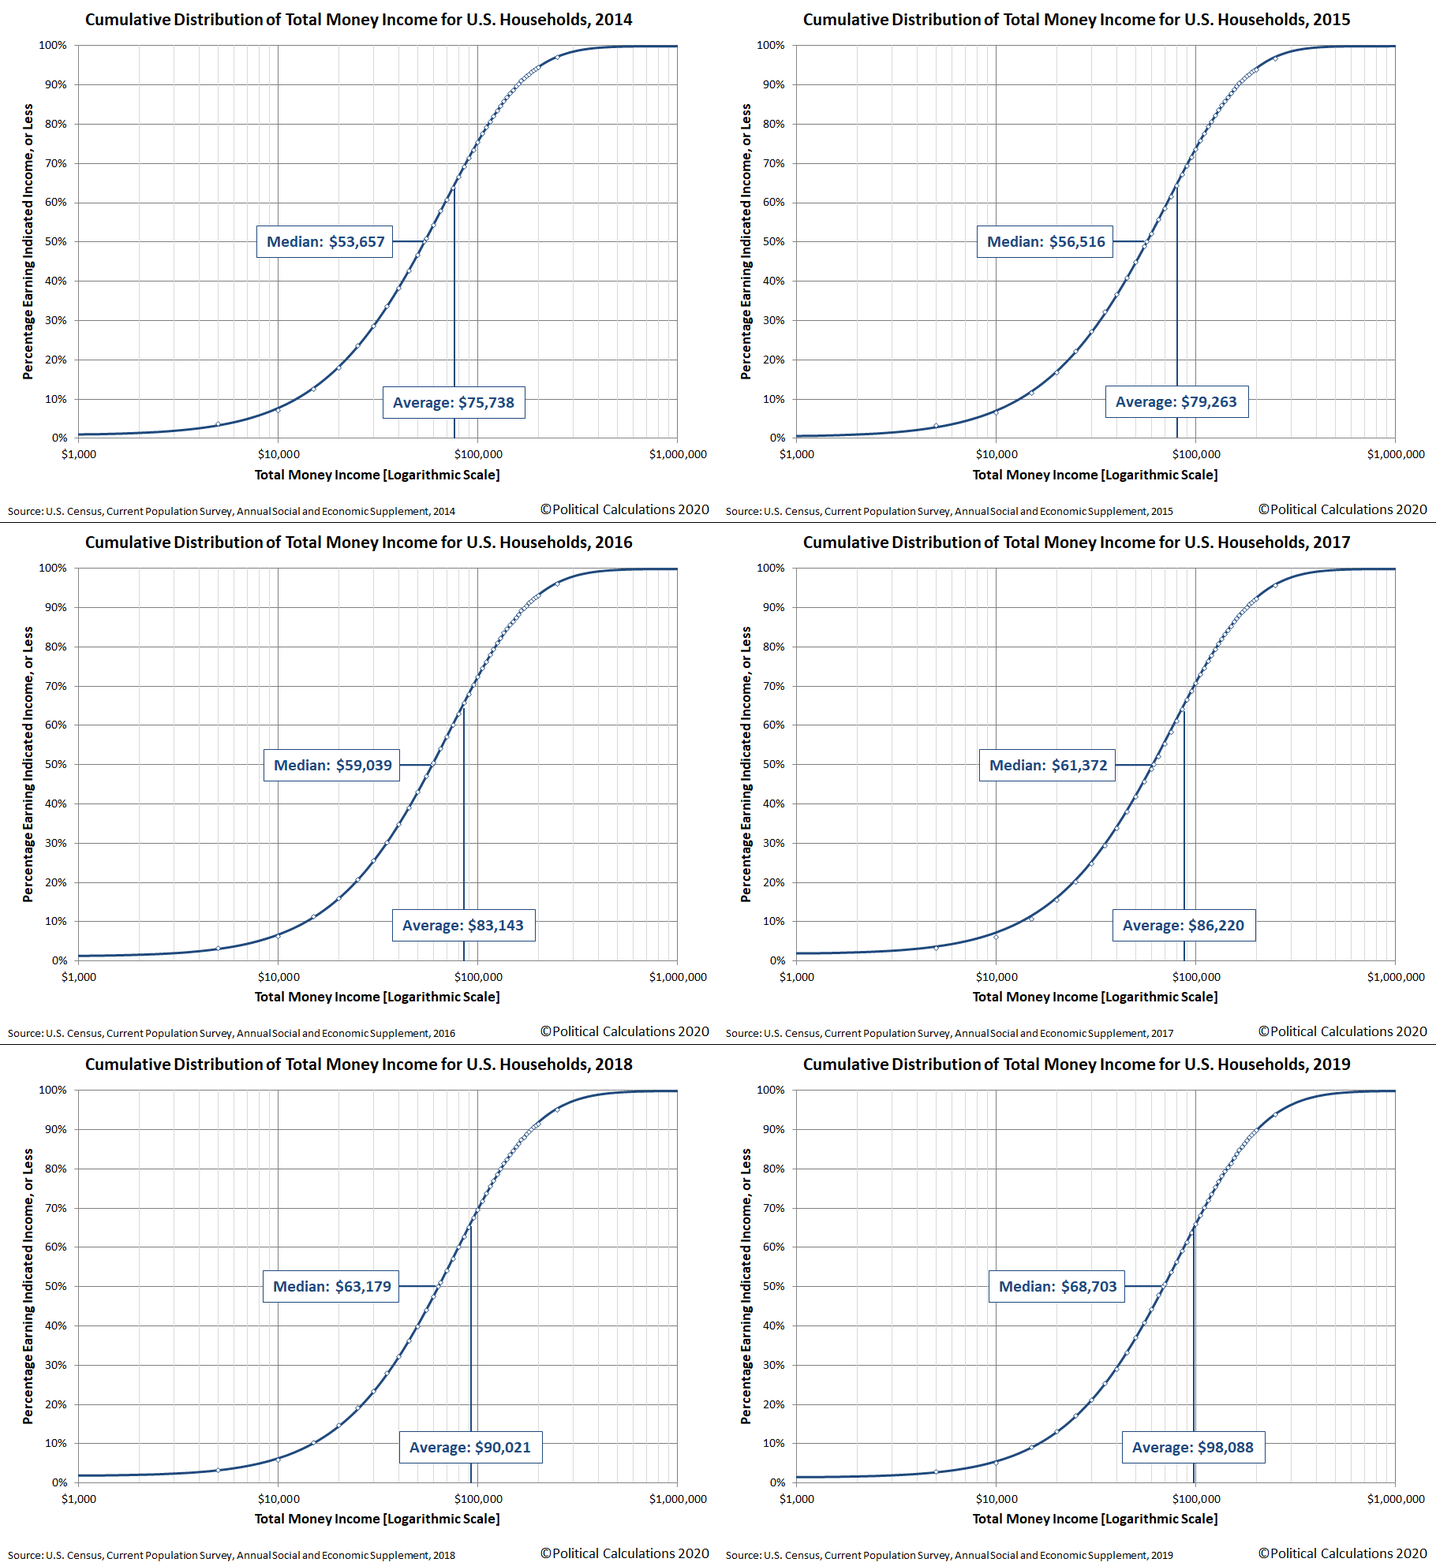
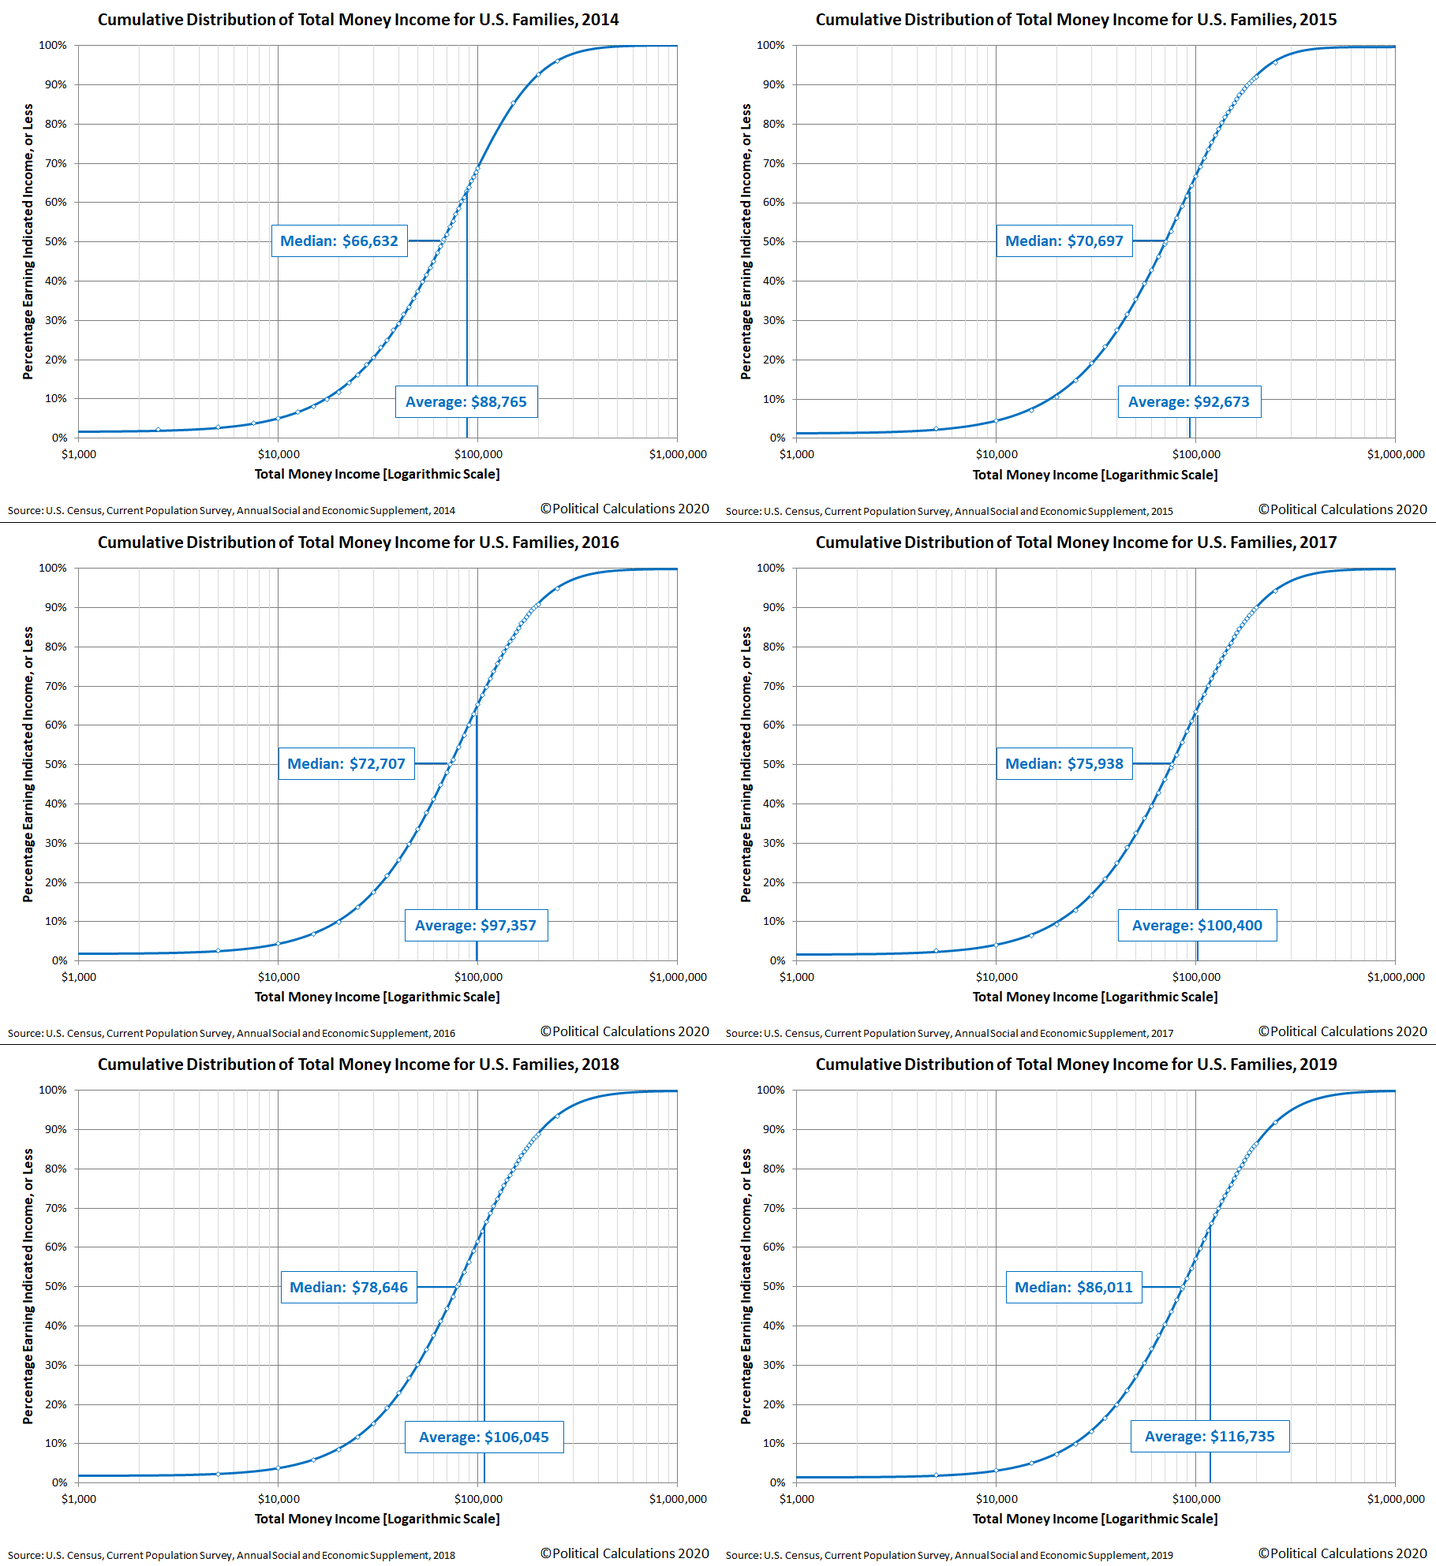
Since the U.S. Census Bureau published its income distribution data for American individuals, households, and families for the 2019 calendar year on 15 September 2020, we thought it would be interesting to show how the distributions for each of these subgroups of the nation's population has changed over time. To do that, we've put together several animated charts to show the evolution of the distribution of income in the U.S. from 2014 through 2019.
Here is the animated chart showing the shifting distribution of total money income for individual Americans:
(Click on image to enlarge)
Next, let's look at the animated chart for the total money income distribution of American households:
(Click on image to enlarge)
Finally, here is the animated chart showing the ongoing development of total money income for American families:
(Click on image to enlarge)
The U.S. Census Bureau distinguishes families from households by recognizing that families are made up of individuals who live together that are related to each other by birth, marriage, or adoption. Households may consist of people who either are related or that are not related as a family.
Each of the animated charts show the distribution of nominal cumulative total money income for American individuals, households, or families, which have not been adjusted for inflation. For each of these groupings, the animations show the distribution of income in the U.S. shifting toward the right, with Americans' incomes rising over time. The rate of increase has accelerated considerably in the most recent years, although we should note that the data for 2019 was collected in early March 2020, before any negative impacts from the Coronavirus Recession would be observed.
The animations also show the shifting distribution of income in the U.S. resulting in a falling percentage of Americans with the lowest incomes during these years, while the percentage of Americans at the upper end of the nation's income spectrum has been rising.
If you would like to keep track of the latest trends for median household income, we estimate that vital statistic each month. Our next update will come on 1 October 2020, when we'll present the latest updates through August 2020. Until then, our estimate of median household income for July 2020 is the latest entry in the series.
Disclaimer: Materials that are published by Political Calculations can provide visitors with free information and insights regarding the incentives created by the laws and policies described. ...
more


