
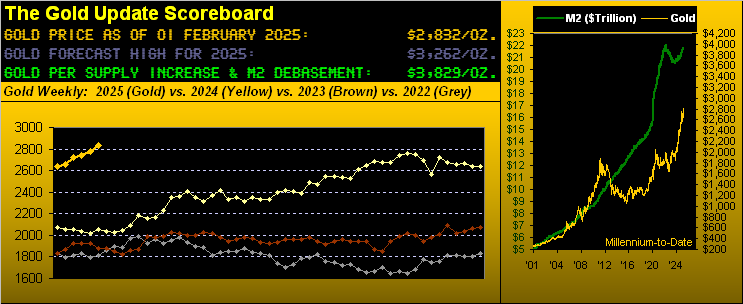
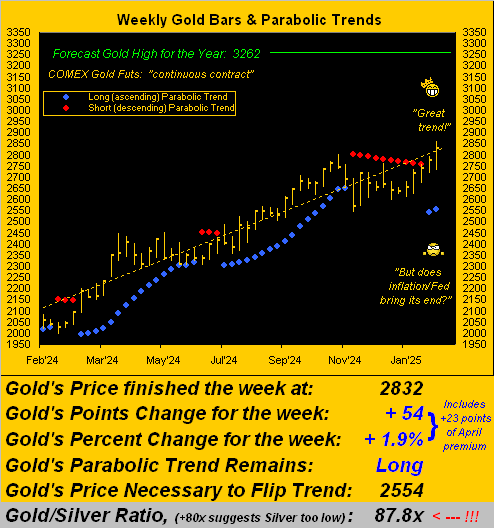
As anticipated would happen this past week per “Gold Goes Long with Three Golden Goals”, Goal One “the next All-Time High for Gold”, was achieved upon the February contract price crossing above 2802 on Thursday at 13:39 GMT, in furtherance moving to as high as 2838 before settling yesterday (Friday) at 2809. Now add in +23 points of April contract premium (February having yesterday gone off the board) and Gold’s “continuous contract” stands today at 2832. Indeed as herein penned a week ago, getting to Goal One would be EPLS (“easy-peasy-lemon-squeezy”). Waiting in the wings is the Goal Two “milestone” of reaching 3000, followed during the balance of the year by Goal Three being our forecast high of 3262.
All very bullish to be sure, but we are also wary that markets do not move in a straight line. For as depicted back in this year’s opening missive, the route to 3262 may well pass through the very low 2500s, especially should the new weekly parabolic Long trend be short-lived notably from an inflation scare followed by a Federal Reserve rate hike, should they dare, something for which the financial world at large seems unaware.
“Oh, c’mon mmb, there’s no way they’d raise, right?”
‘Tis at present not expected, Squire. The StateSide President is glowering over the Fed to resume cutting its rates. We instead are scouring inflation rates. And with December’s key inflation measures now in the books, one may say the Open Market Committee’s unanimously voting per last Wednesday’s Policy Statement to “maintain the target range for the federal funds rate at 4-1/4 to 4-1/2 percent“ was arguably the right thing to do. For little did the en masse state of inflation change month-over-month. Problematic thereto, however, is that every inflation metric save for the Core Producer Price Index — be it by 12-month summation or by December’s pace annualized — is still above the Fed’s goal of 2.0%. To wit, our updated inflation table, paces with red backgrounds in excess of 2.0%:
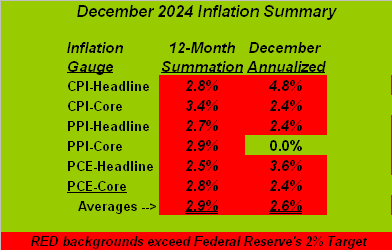
Thus we await inflation reports for January and February toward the FOMC’s next decision due 19 March. Conventional FinMedia wisdom apparently assumes rate cuts are to resume, whereas we’ll side with the math for what the Fed may decide.
As to “The Now”, decisiveness for the BEGOS Markets Standings year-to-date sits with Silver getting the best bid so far with our Metals Triumvirate dominating the podium. We’ve advocated for some four years “Don’t forget the Silver!” as the Gold/Silver ratio since March 2021(then 66x) has climbed up and away from its century-to-date average which today is 68.7x versus the actual ratio now of 87.8x. So yes, Sister Silver is leading the BEGOS bunch, but she’s still cheap! Here’s the whole gang:
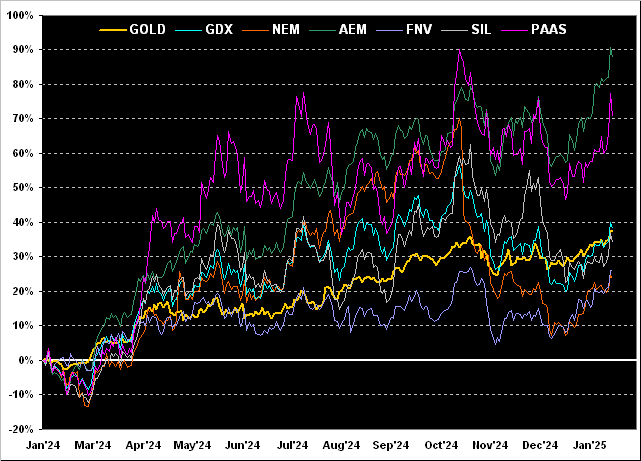
Indeed speaking of Silver, let’s take a peek at Pan American Silver (PAAS) which year-over-year is +71%, second only amongst the key precious metals’ equities brethren to Agnico Eagle Mines (AEM) that is +88%. Filling out the following graphic of their respective percentage tracks, we also see the VanEck Vectors Gold Miners exchange-traded fund (GDX) and Gold itself both +38%, the Global X Silver Miners exchange-traded fund (SIL) +34%, Franco-Nevada (FNV) +26%, and the lately laggard Newmont (NEM) finally +24%:
Specific to Gold, as noted ’tis in a new weekly parabolic Long trend per the next chart’s two rightmost blue dots. To be sure, the trend across the whole one-year graphic is ever so pristinely positive. In fact, extrapolating the dashed regression trendline through the final 47 remaining weeks in 2025 puts the year-end price at 3452 (some +190 points above our forecast 3262 high). But again as duly written, hardly are markets unidirectional, and for Gold on this present parabolic Long trend to achieve Goal Two of the 3000 “milestone” would be fabulous. Indeed were the dashed trendline’s pace to be maintained, Gold would reach that goal in 14-weeks’ time by that ending 08 May. Not to hold one’s breath, but ’tis for something to play:
Turning to the StateSide economy, if you’re like us, upon the FOMC releasing a Policy Statement, we absolutely avoid exposing ourselves to the FinMedia and their excitedly emotional excesses. Rather, we simply read the actual Statement. And if you so did this past Wednesday, you’ll recall the opening sentence: “Recent indicators suggest that economic activity has continued to expand at a solid pace.”
Now in the Fed’s defense (assuming by Wednesday they were not tipped off by the Bureau of Economic Analysis’ Q4 GDP data and December’s PCE data, respectively released Thursday and Friday), the FOMC did not see the stagflative suggestions therein.
“You say ‘stagflative’, mmb?”
Indubitably so, dear Squire. First to Gross Domestic Product, for which “real” Q4 growth came in at a +2.3% annualized pace, having thus slowed from +3.1% in Q3. But wait, there’s more: per the “Chain Deflator”, whereas inflation contributed to 38% of nominal Q3 GDP growth, for Q4 the inflation component increased to 49%. Thus as you learned in “B” school: slowing growth + increasing inflation = stagflation. Further, both of the Personal Consumption Expenditures readings increased for December, such “Fed-favoured” inflation gauge increasing from +0.1% to +0.3% (headline) and +0.1% to +0.2% (core). What it all means for you WestPalmBeachers down there is you’re growing less but paying more. Here’s the Baro:
However, on balance for the week the Baro managed a wee uptick. Yet fickle amongst the 12 incoming metrics was Home Sales data. For December, New Home Sales increased, beat consensus, and had November revised upward; but in a mirror image, December’s Pending Home Sales decreased, missed consensus, and had November revised downward.
As for the S&P 500 which fundamentally remains catastrophically overvalued given puny earnings, we’ve gone on-and-on since COVID that — earnings aside — the math-challenged FinMedia had remained rather vapid for coming up with a crash catalyst. But now, per the above graphic and to use an expression from the old Westerns, “They’ve got their man!” Who better, eh? More on the S&P in our wrap.
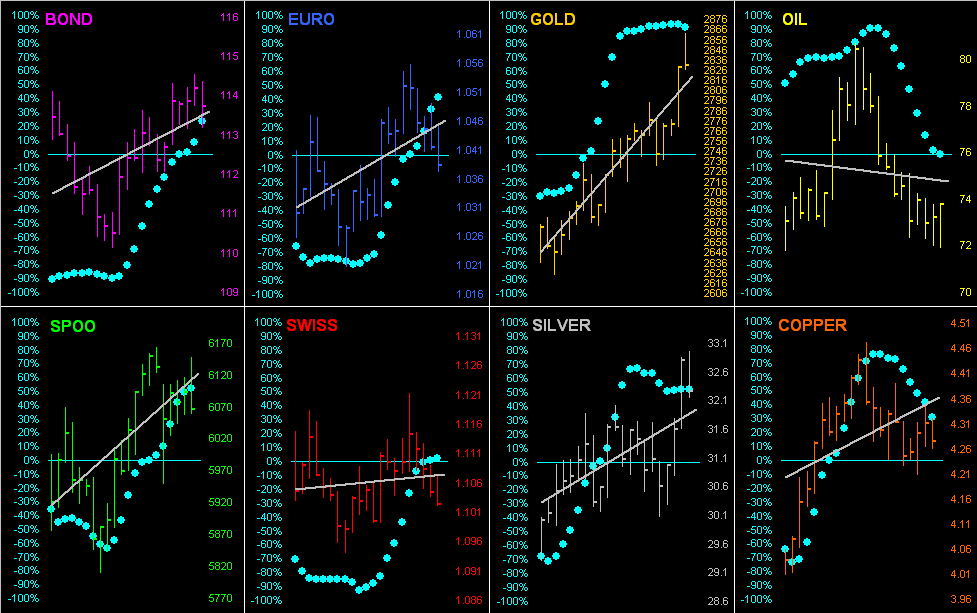
But next let’s wrap ourselves ’round the BEGOS Markets of late. Earlier, you saw their Standings. Now here are the past 21 daily bars bars for all eight components with — save for Oil — all in linear regression uptrends, even as the Dollar is (barely) not net down for the year. The baby blue dots are, of course, the day-to-day depiction of each grey trendline’s consistency. And those for Copper (in certain circumstances considered to be a leader of precious metals’ prices) are in retreat; something for which to be sensitive:
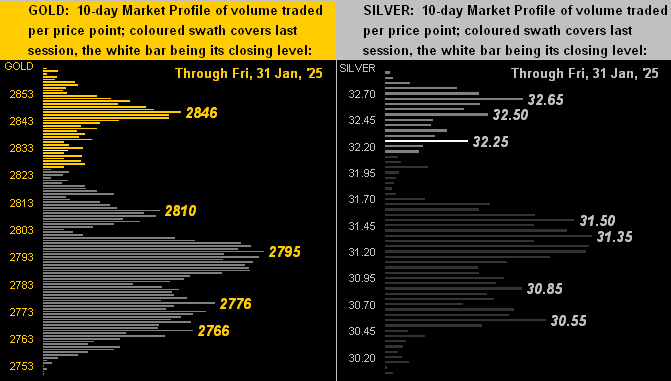
As to the 10-day Market Profiles for the precious metals, with Gold on the left the upper 2700s appear supportive, whilst with Silver on the right same can be said for the lower 31s:
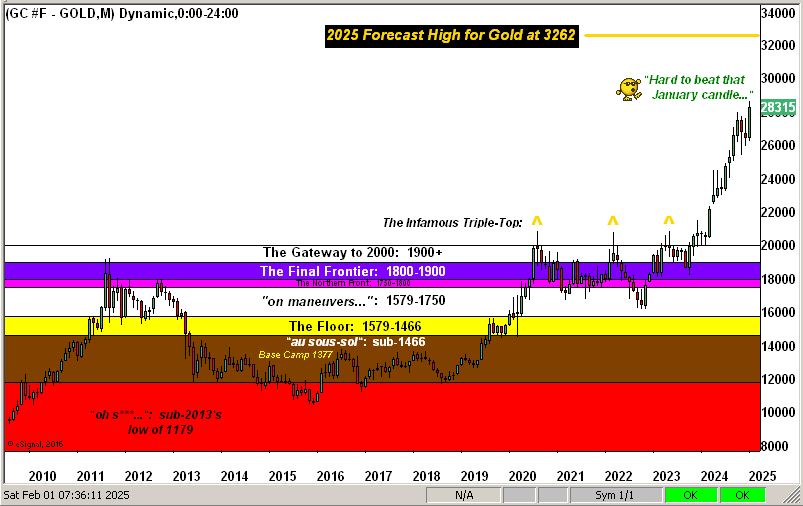
And it being month-end, ’tis time to update our view of Gold’s layered structure by the month across the last 16 years. Indeed January was a fine start to the year for Gold:
To wrap, as noted we’ve (yet another) cautionary note with respect to the S&P 500. The Index’s all-time closing high is 6119 as of just seven trading days ago on 23 January. But since the ensuing six trading days — including the “Daunt de DeepSeek” of Monday, 27 January (prior to which you’ll recall we’d last week penned “…the next … ‘correction’ … shall morph Wall Street emotion from ‘No Fear!’ into ‘Nuthin’ BUT Fear!’…”) — the S&P has lost a net -78 points to now sit at 6041 (en route having been down as many as -156 points to 5963 during that Monday’s quickie-crash). Moreover, (hat-tip Dow Jones Newswires), Deutsche Bank suggested such “…impact may see market deflate as in dot-com bust…” Yet it giddily then came all the way back to “fill the gap”. Oh is Wall Street — albeit now terribly fragile — ever so relieved that it didn’t all go wrong (yet).
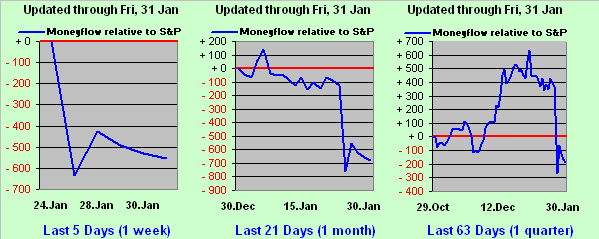
But here’s the part for which they’ve not been informed (barring their following the website’s MoneyFlow page): the S&P’s net change from the all-time high to right now via the MoneyFlow regressed onto the S&P scale is -668 (“minus six-hundred sixty-eight”) points. In other words for those of you scoring at home: the S&P is now -78 points below its all-time closing high; but by its MoneyFlow ’tis -668 same-scale points below same. And as you know, flow leads dough:
Or to reprise Bachman Turner Overdrive from back in ’74: ![]() “You Ain’t Seen Nothing Yet…”
“You Ain’t Seen Nothing Yet…”![]()
Thus let it be Gold that gets your dough!
Cheers!
More By This Author:
The Gold Update: Gold Goes Long With Three Golden GoalsThe Gold Update: Gold Gets Close, But No Cigar
The Gold Update: Gold’s Short Trend Nearing Its End


Comments
Log in or sign up to join the conversation.