
The Future Thru Futures: CoT This Week
Following futures positions of non-commercials are as of October 6, 2020.
10-year note: Currently net long 69.5k, down 59.1k.
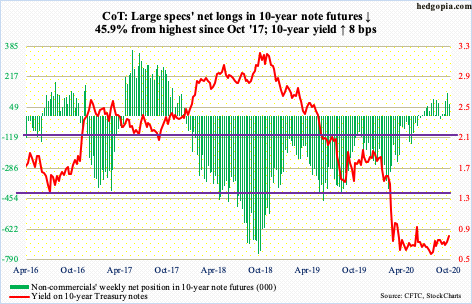
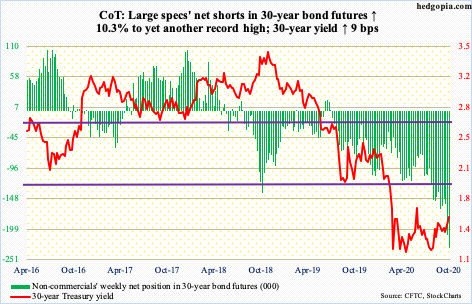
The 30-year Treasury yield (1.57 percent) this week broke through its 200-day moving average (1.55 percent), having taken out the 50-day (1.41 percent) two months ago. The 10-year yield (0.78 percent) pushed through its 50-day (0.67 percent) early August as well, but it remains under the 200-day (0.91 percent).
At the end of last year, the spread between these two yields was 47 basis points. This has now widened to 80 basis points. Non-commercials are betting this continues. They hold record net shorts in 30-year bond futures, even as last week’s net longs in 10-year net futures were the highest since October 2017.
Increasingly, these traders seem to be betting on a Joe Biden victory on November 3, which likely translates to larger deficits. For this scenario to pan out, the Senate, too, needs to go to the Democrats. Else, in due course markets should have a hard time believing the yield curve steepens sharply.
30-year bond: Currently net short 230.3k, up 21.5k.
Major economic releases next week are as follows.
The NFIB optimism index (September) and the consumer price index (September) are on tap for Tuesday.
Small-business job openings increased three points m/m in August to 33. Earlier, the sub-index reached 23 in May. Between December 2018 and July last year, a record 39 was hit three times.
Over July, consumer prices – both headline and core – increased 0.4 percent in August. In the 12 months to August, they respectively increased 1.3 percent and 1.7 percent.
The producer price index (September) is due out Wednesday. In August, headline and core producer prices both rose 0.3 percent m/m. In the 12 months to August, they fell 0.2 percent and gained 0.3 percent, in that order.
Friday brings retail sales (September), industrial production (September), the University of Michigan’s consumer sentiment (October, preliminary) and Treasury International Capital data (August).
Retail sales grew 0.6 percent m/m in August to a seasonally adjusted annual rate of $537.5 billion – a new high. Earlier in April, sales were down to $412.8 billion.
Capacity utilization in August dropped 8.2 percent from a year ago to 71.4 percent. Utilization has improved from April’s 64.1 percent.
Consumer sentiment in September rose 6.4 points m/m to 80.4 – a six-month high. Sentiment dropped to 71.8 in April.
In July, the 12-month rolling total of foreigners’ purchases of US stocks reached $157 billion, down slightly from June’s $165.2 billion, which was the highest 12-month total since April 2010.
WTI crude oil: Currently net long 534.2k, down 3.4k.
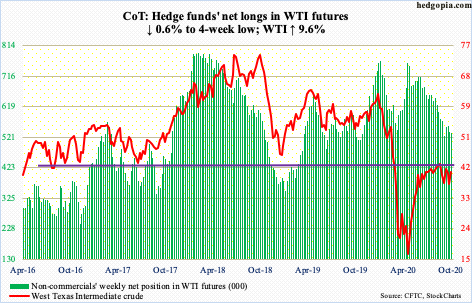
WTI ($40.60/barrel) last Friday dropped to $36.63 intraday, testing $36.13 posted on September 8. Oil bulls were not willing to lose the level. This week began with a rally, and by Tuesday the 200-day ($39.15) was captured, followed by the 50-day ($40.83) on Thursday. The 10- and 20-day lie in between (respectively at $39.75 and $39.77).
For over three months now, bulls have been unable to decisively take out $41-$42, although the crude rose as high as $43.78 intraday on August 28. Friday, WTI printed $41.47 intraday before coming under slight pressure, dipping under the 50-day again. The 200-day likely gets tested again.
In the meantime, the EIA report for the week to October 2 showed US crude production rose 300,000 barrels per day to 11 million b/d. Five weeks ago, production was down to 9.7 mb/d, which was the lowest since January 2018. Crude imports were up 610,000 b/d to 5.7 mb/d. As were crude stocks – up 501,000 barrels to 492.9 million barrels. Stocks of gasoline and distillates, however, dropped 1.4 million barrels and 962,000 barrels to 226.7 million barrels and 171.8 million barrels, in that order. Refinery utilization was up 1.3 percentage points to 77.1 percent.
E-mini S&P 500: Currently net long 74k, up 1.8k.
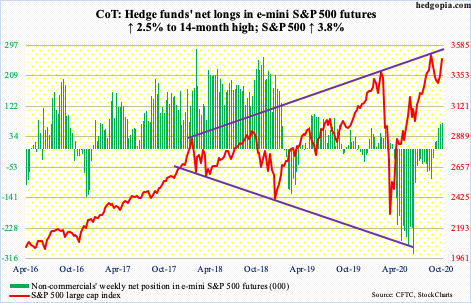
After trying for nearly a month, bulls finally pushed through 3390s, which is where the S&P 500 (3477.14) peaked back in February – just before the February-March collapse. The large-cap index also broke out of one-month inverse head-and-shoulders. The pattern is not very clean, but it is there. If enough people believe it is genuine, it just may act as a self-fulfilling prophecy.
From bulls’ perspective, the good thing is that they managed to defend the 50-day (3380.30). Plus, there is now a 10/20 crossover. If the breakout is genuine, the technically oriented ones would be eyeing 3600. The S&P 500 peaked at 3588.11 on September 2.
For the week, the index rallied 3.8 percent, although flows were not in cooperation. In the week to Wednesday, $6 billion came out of US-based equity funds (courtesy of Lipper). In the same week, SPY (SPDR S&P 500 ETF), VOO (Vanguard S&P 500 ETF) and IVV (iShares Core S&P 500 ETF) collectively lost $6.4 billion (courtesy of ETF.com).
Euro: Currently net long 174.3k, down 13.8k.
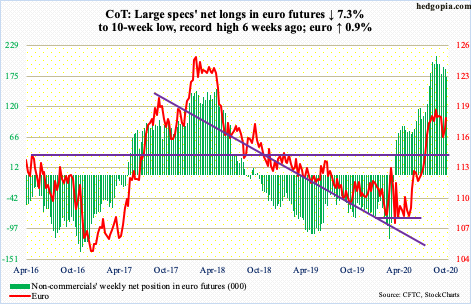
Nearly three trading weeks ago, the euro ($1.1826) lost both straight-line support at $1.17-$1.175 as well as the 50-day ($1.1801). After that breakdown, it dropped to $1.1612 by September 25. The rally since that low stopped early this week at the 50-day – until Friday when the average was reclaimed.
Friday’s action could not have been timed better for euro bulls. The 50-day is flattening out, and the currency remains overbought on both the weekly and monthly. Next week is crucial. There is major resistance at $1.19-$1.20, which goes back to May 2003.
Gold: Currently net long 248.6k, up 4.9k.
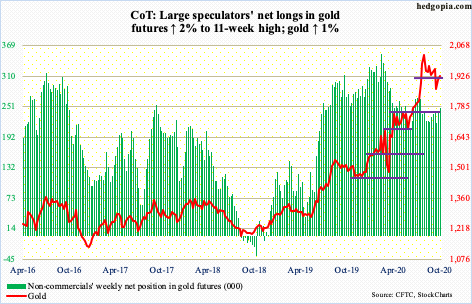
Gold ($1,926.20/ounce) began the week where it left off. Last Thursday and Friday, the metal saw sellers active at $1,920s. In September 2011, gold retreated after posting $1,923.70. That record was surpassed in the last week of July this year, leading to a new high of $2,089.20 on August 7.
On September 21, gold sliced through both $1,920s and the 50-day ($1,949.31). Since bottoming at $1,850s later that month, gold has tried to rally, but sellers continue to show up at the support-turned-resistance, including early this week. The 50-day is now beginning to point down.
Friday, the metal rallied 1.6 percent to close out the week right at $1,920s. The longer gold bugs struggle to reclaim this level, the bigger the temptation for longs who have ridden the rally the past several months to lock in gains. Gold bottomed at $1,450.90 on March 16. Billions have gone into the yellow metal through gold-focused ETFs.
In the week to Wednesday, IAU (iShares Gold Trust) took in $97 million. In the prior 28 weeks, there was one week of outflows, for a cumulative haul of $7.9 billion. In those 29 weeks, GLD (SPDR Gold ETF) had five weeks of outflows for total gains of $19.5 billion, including $156 million in the week to Wednesday (courtesy of ETF.com).
Nasdaq 100 index (mini): Currently net short 75k, down 4.7k.
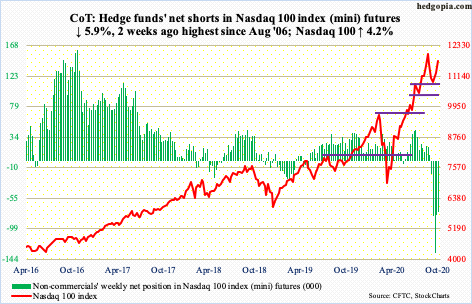
Similar to the S&P 500, the Nasdaq 100 (11725.85) just broke out of what looks like an inverse head-and-shoulders formation. The neckline gets broken at 11500-11600, which, after trying for a month, fell Friday.
Earlier, in the second half last month, bulls lost the 50-day but defended 10600-10700. Two weeks ago, the average (11376.18) was recaptured. But pushing through 11500-11600 had proven difficult.
Non-commercials continue to be the wildcard. Two weeks ago, they had accumulated net shorts which were the highest since August 2006. They have cut back since, but holdings remain massive.
Russell 2000 mini-index: Currently net long 25.4k, up 16.7k.
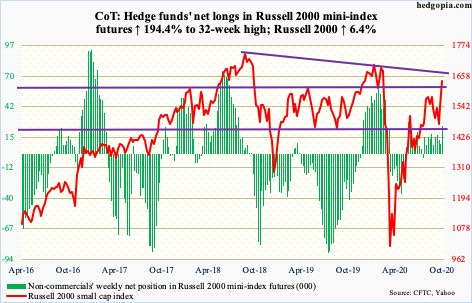
Small-caps are going gangbusters. From the low on September 24, the Russell 2000 is up 14.3 percent. Back then, bulls defended 1450s-60s, which approximated the 200-day. This was preceded by rejection at 1600-plus on August 11; this level has proven to be important going back to January 2018. The roadblock gave way this week (more on this here). The index (1637.55) has not been above this price point since late February this year. Now, bulls probably have their sights set on the all-time high of 1742.09 from August 2018, which is 6.4 percent away. This week, the Russell 2000 rallied precisely that much.
US Dollar Index: Currently net short 3k, down 2.5k.
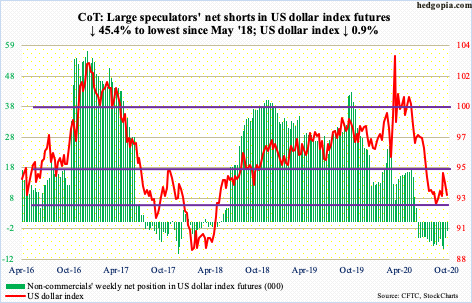
Nearly three weeks ago, the US dollar index (93.07) broke out of a two-month range. It had been rangebound between 92 and 94 since late July. Prior to that, it dropped from 103.96 on March 23 to 91.75 on September 1. Support at 92 goes back to at least June 2003 and was tested for nearly two months before the index began to lift off three weeks ago.
Post-breakout, bulls could only rally to 94.79, which was reached intraday on September 25, followed by a failed retest this week. Friday, the index sliced through the 50-day (93.31). This opens the door to a test of 92.70s, followed by 92. The latter is a must-hold.
VIX: Currently net short 93.6k, up 3.8k.
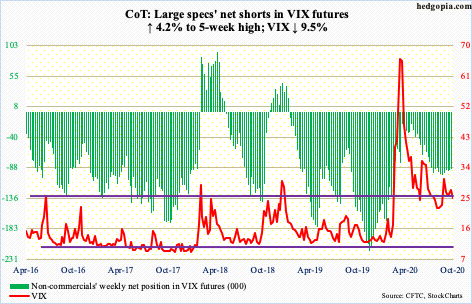
The 200-day (30.03) continued to come in the way of volatility bulls. For four consecutive sessions through Wednesday, VIX (25) was denied at the average. By Friday, the 50-day (25.54) was compromised.
Once again, daily Bollinger bands are narrowing, with 4.57 points separating the two. If past is prelude, this precedes a sharp move – either up or down. The daily has room to go lower. Support at mid-20s is crucial. A decisive breach can expose the volatility index to low-20s.
Disclaimer: This article is not intended to be, nor shall it be construed as, investment advice. Neither the information nor any opinion expressed here constitutes an offer to buy or sell any ...
more


interesting indeed, but not encouraging from where I stand.