The Explosive Growth Of Private Credit: Is There A Bubble?

Image Source: Pexels
The growth of the private credit market exploded after the global financial crisis of 2008-2009 as private credit rushed to fill the gap that the banking industry was no longer able to fill because of the distress of its balance sheets. Tightened capital standards made loans to middle-market companies unattractive for banks, shutting out most small- and middle-size companies from the bank market. In addition, the 2010 enactment of the Dodd-Frank Act made it increasingly expensive for small banks to operate, cutting off their supply of loans to small and mid-size companies.
Another reason for the explosive growth is that corporations have found benefits in private lending that are sufficient to offset their higher yields. Those benefits include:
- Speed of execution.
- No mandated public disclosure of proprietary information.
- Less ongoing disclosure requirements required for fundraising in the public market.
- Avoiding the time-consuming and expensive process of obtaining a rating from one or more of the rating agencies.
- The ability to customize the loan structure to meet the particular needs of the borrowing company, offering management greater flexibility.
- A borrower facing financial difficulties will find it is easier in a private debt transaction for management to do a workout with only one or a few lenders compared to a large number of lenders in a public bond offering.
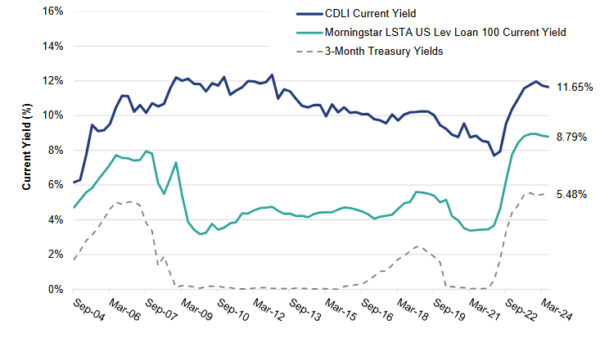
The growth rate of private credit has been so rapid (growing to nearly $2 trillion by the end of 2023, roughly ten times larger than it was in 2009), that concerns about there being a bubble have been raised. For example, in October 2024, PIMCO warned: “Private debt doesn’t offer high enough returns to justify the growing risks.” If that were the case we would see that both the credit spread would have come way down and lending standards (covenants and loan-to-values) would have loosened. Looking at the Cliffwater Corporate Lending Fund (CCLFX)—with about $23 billion invested in senior, secured private loans that are backed by private equity sponsors—we don’t see any signs of either. As of the end of the third quarter, the average loan-to-value was just 41% and the fund was providing a net yield of about 11.5%, about 6.5% above the one-month Treasury bill rate and about 3.3% above the yield on the Morningstar LSTA Leveraged Loan Index. Such figures don’t show any indication of a bubble.
The following chart about current yields also shows that there has been no decline in spreads. In fact, it shows that spreads are at their highest level.

The results are hypothetical results and are NOT an indicator of future results and do NOT represent returns that any investor actually attained. Indexes are unmanaged and do not reflect management or trading fees, and one cannot invest directly in an index.
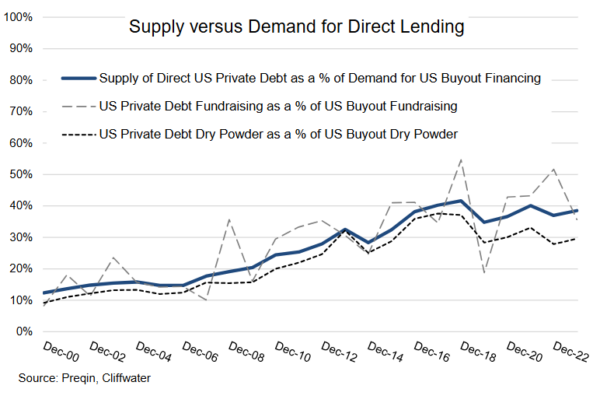
As further evidence of the lack of signs of a bubble, the following chart provides three related metrics that put the growth of performing private debt in the context of a broader US private market ecosystem that has been growing at three times the rate of the public markets over the last 20 years. The three metrics are fundraising, dry powder, and total supply/demand.

All three metrics express private debt as a percent of US buyouts, the segment of private equity that most utilizes private debt for financing. Since approximately 50% of US buyouts is debt financed, US private debt would equal approximately 100% of US buyout equity capital if it was the only source of financing. However, as the solid line in the chart shows US private debt, represented by the Preqin database consisting primarily of institutional private debt capital, represents approximately 40% of the financing needs of US buyout firms. If there were too much new institutional supply, which includes public and private BDCs, market penetration would be increasing, pushing out other suppliers of buyout financing like banks, insurance companies, non-bank finance companies, and hedge funds.
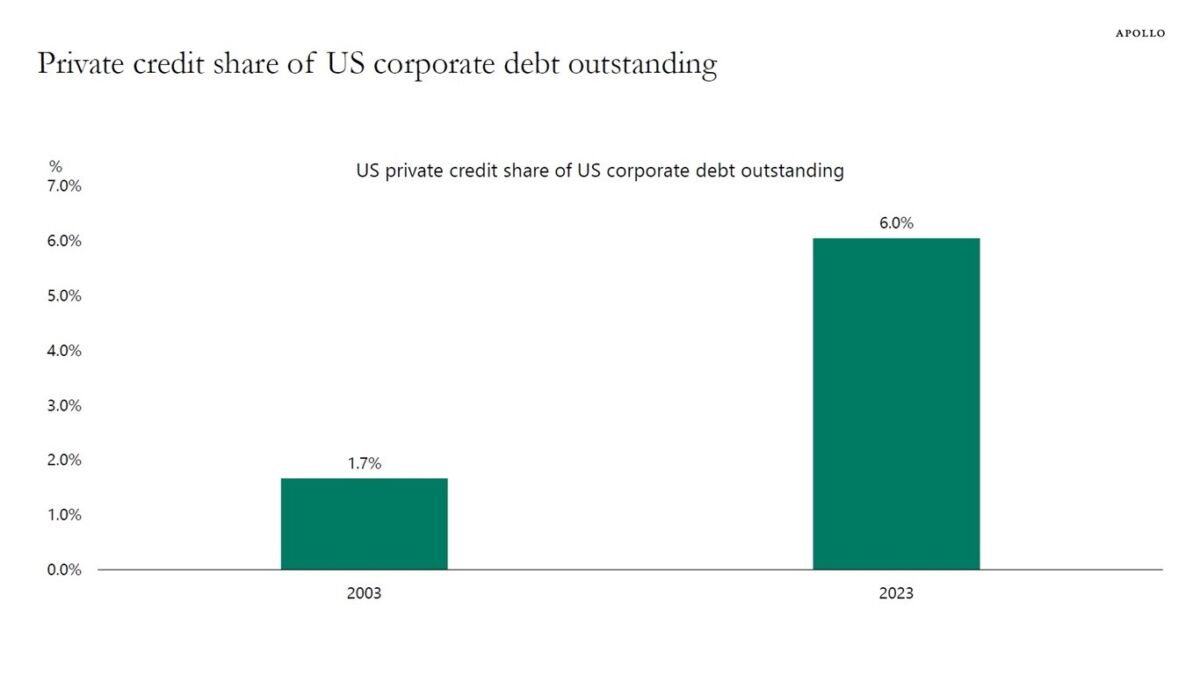
It’s also important to note that despite the rapid growth, looking at the sum of bank lending to corporates plus the total value of corporate credit markets plus the total value of private credit shows that private credit only makes up 6% of total lending to corporates (chart below). Thus, there is still plenty of room for growth in the sector. In its “Future of Alternatives 2029” Pequin (leading provider of data and insights for the alternative investments industry) forecast private debt to grow further an average of 12.0% from end-2023 to 2029F.

The bottom line is that private credit will continue to grow as companies get access to a broader spectrum of financing.
More By This Author:
Markets Becoming More Efficient: The Disappearing Index Effect
Using Trading Volume To Optimize Portfolio Construction And Implementation
Artificial Intelligence, Textual Analysis And Hedge Fund Performance


