The Comprehensive Revisions: Little Change In Trajectory
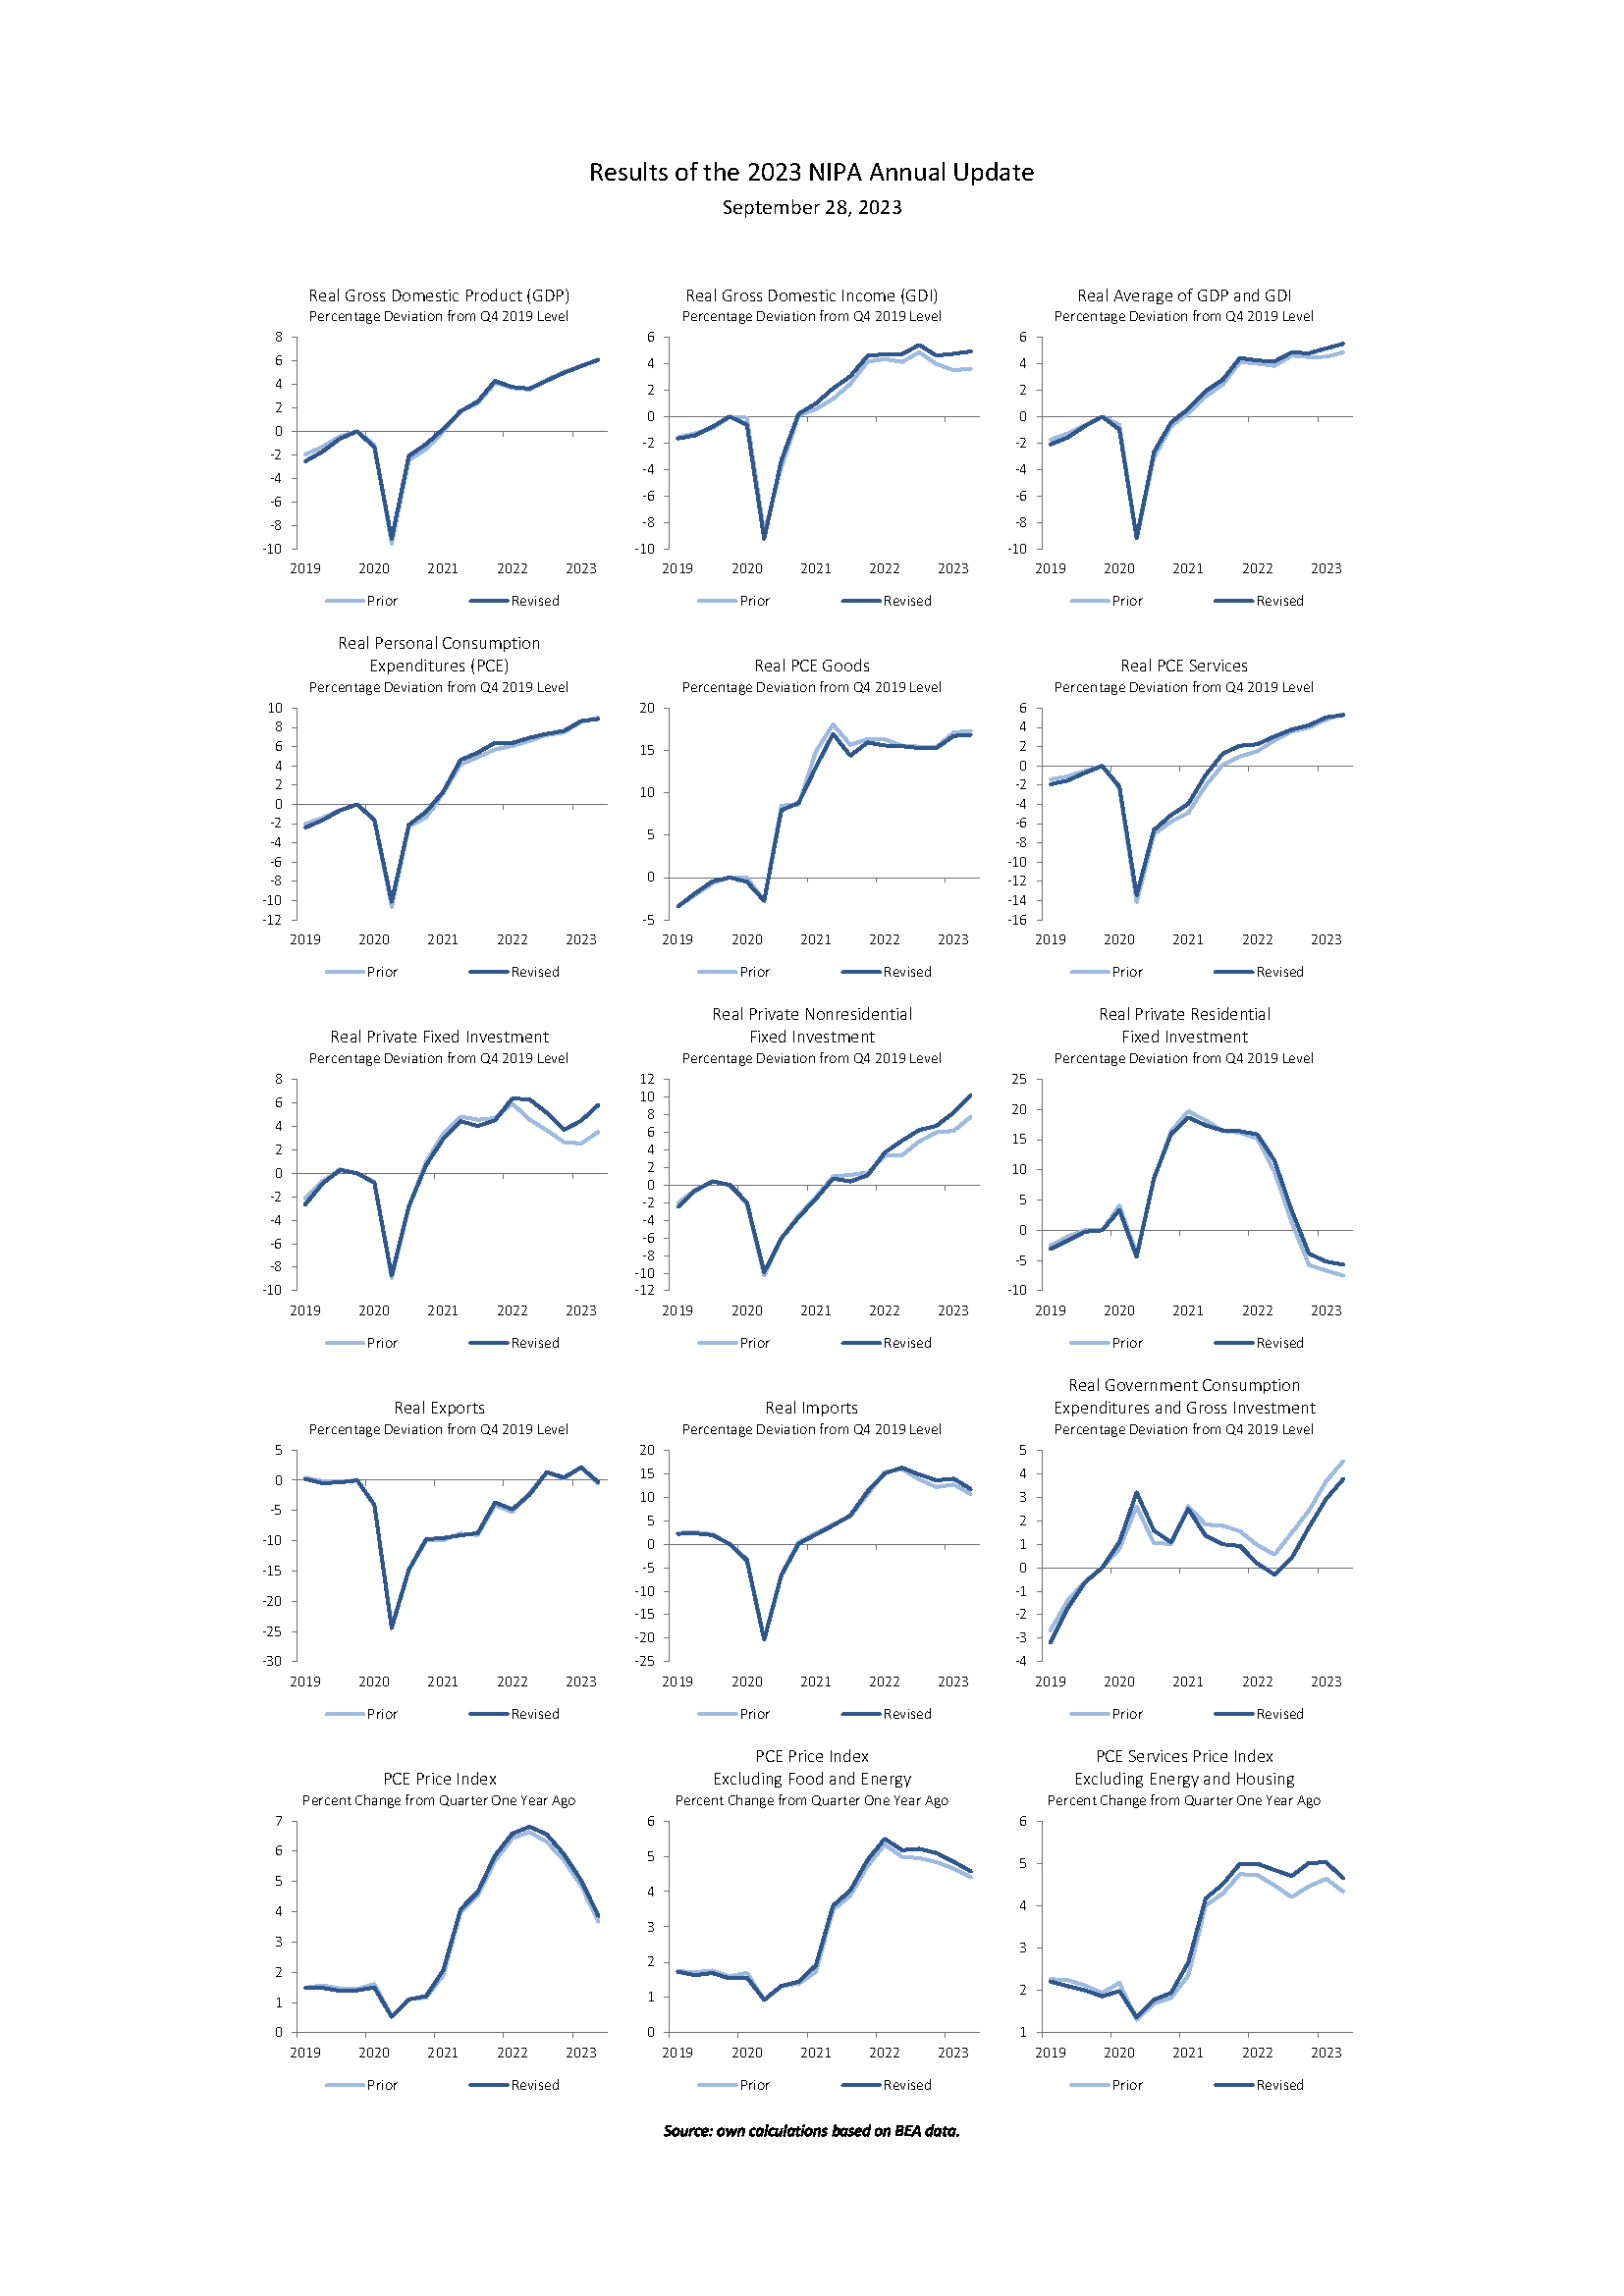
Despite some views that GDP growth would be revised downward substantially (see discussion here), the recent trajectory of GDP and GDO was largely unchanged (even if the level over the period 2019 onward was). A lot of the revisions are summarized in this figure from Paweł Skrzypczyński:
(Click on image to enlarge)
Source: Paweł Skrzypczyński.
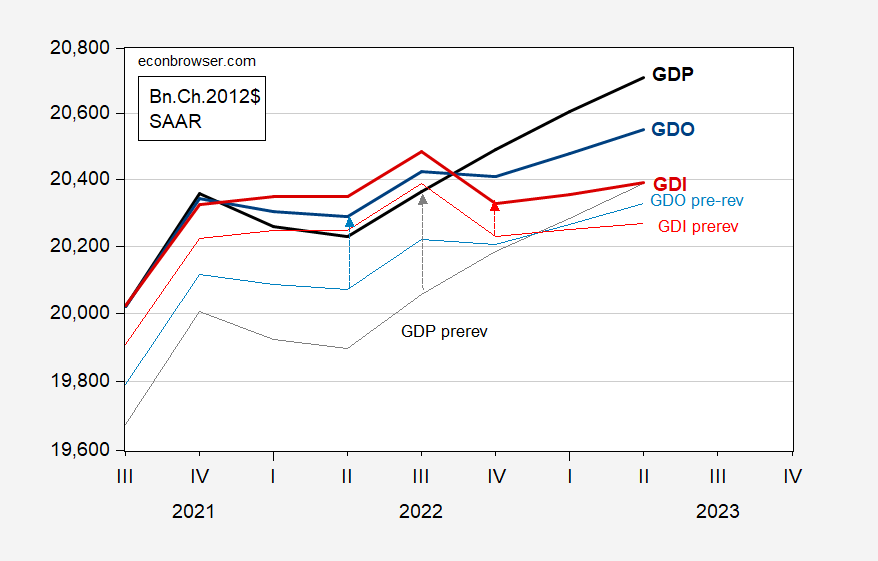
Since the data are indexed to 2019Q4 (NBER defined peak), it’s hard to see that the level of real GDP, GDO, and GDI in recent quarters has been substantially shifted up. I show these aggregates in Chained 2012$ (SAAR) to better see this point.
Figure 1: GDP post-revision (bold black), GDP pre-revision (gray), GDI post-revision (bold red), GDI pre-revision (light red), GDO post-revision (bold blue), GDO pre-revision (light blue), all in Chained 2012$ SAAR. Post-revision 2012 figures calculated by dividing nominal values by rescaled post-revision GDP deflator. Source: BEA 2023Q2 3rd release/comprehensive revision, ALFRED, and author’s calculations.
One big difference is the level of fixed nonresidential investment (see dead center graph in Skrzypczynski’s figure). More on that soon.
More By This Author:
Musings On Economic Policies In A Trump Second TermSome Forecasts Of Industrial Production Growth
Almost Half A Century Of The Economic Policy Uncertainty Index


