
Yesterday’s Bloomberg article “Fed Staff Sees a 50-50 Chance of Recession” spurred me to examine the implications of the latest readings on term spreads. Figure 1 depicts the recession probabilities estimated using a simple probit model based on the 10yr-3mo and 10yr-2yr spreads, through November 23rd.
(Click on image to enlarge)

Figure 1: Forecasted probability of recession from 10yr-3mo term spread (blue), from 10yr-2yr term spread (tan), 10yr-3mo term spread augmented by FCI, foreign term spread (green). All models estimated over 1986M01-2022M11. NBER defined peak-to-trough recession dates shaded gray. Red dashed line at 50% probability. Source: author’s calculations, NBER.
While neither the 10yr-3mo nor 10yr-2yr models breach the 50% threshold, they are sufficiently close to merit a 50-50 reading.
In work by Ahmed and Chinn (2022), it’s shown that the foreign term spreads and financial conditions index have additional predictive power for US recessions (see Table A.1). I augment the 10yr-3mo spread with the average of German-Euro Area/UK/Japan 10yr-3mo spreads, and the national financial conditions index, to obtain the estimated probabilities of recession shown in the green line in Figure 1. The reading for November 2023 is 56%.
All these estimates are based upon the following term spreads:
(Click on image to enlarge)
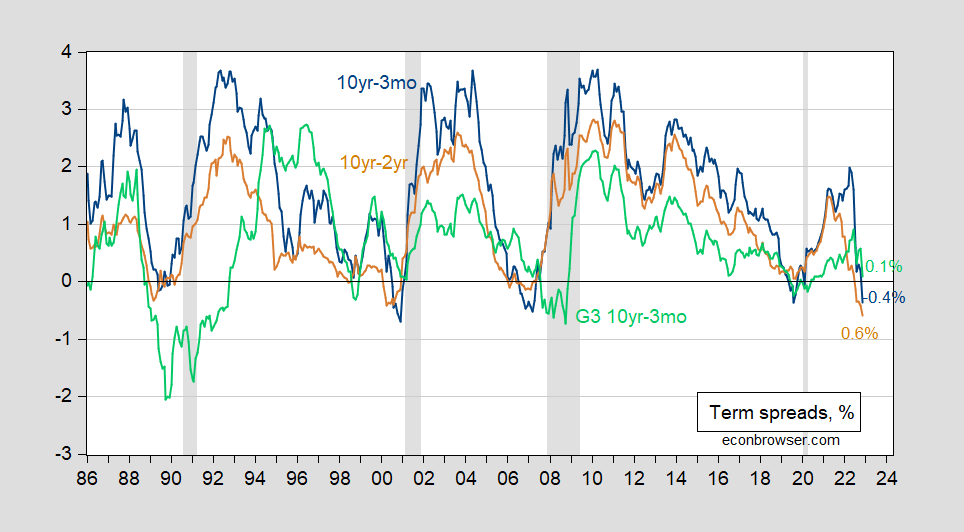
Figure 2: US Treasury 10yr-3mo term spread (blue), 10yr-2yr (tan), and G3 Germany/UK/Japan 10yr-3mo (green), all in %. NBER defined peak-to-trough recession dates shaded gray. Source: Treasury via FRED, OECD Main Economic Indicators, NBER, and author’s calculations.
More By This Author:
How To End An Endless DebateCFNAI on the Putative Recession of 2022H1
Business Cycle Indicators At Mid-November


Comments
Log in or sign up to join the conversation.