Zoom Has Lost Its Va Va Voom!
Zoom (ZM) has been one of the ‘darling’ stocks of the pandemic, but since the sustained rally of June 2021 which saw it reclaim the $400 per share level, the longer-term weakness has prevailed once more and accelerated further with the plunge which occurred on the last day of August, taking the price down to $288.30 from which it has since staged a modest recovery. At the time of writing it is trading just below $300 per share at $297.72. As mentioned in my opening statement, this is a stock in a longer-term trend lower, and well off the dizzying heights of October 2019 at $588 per share. The question now is whether we are likely to see the price bounce once again or has the COVID effect run its course?
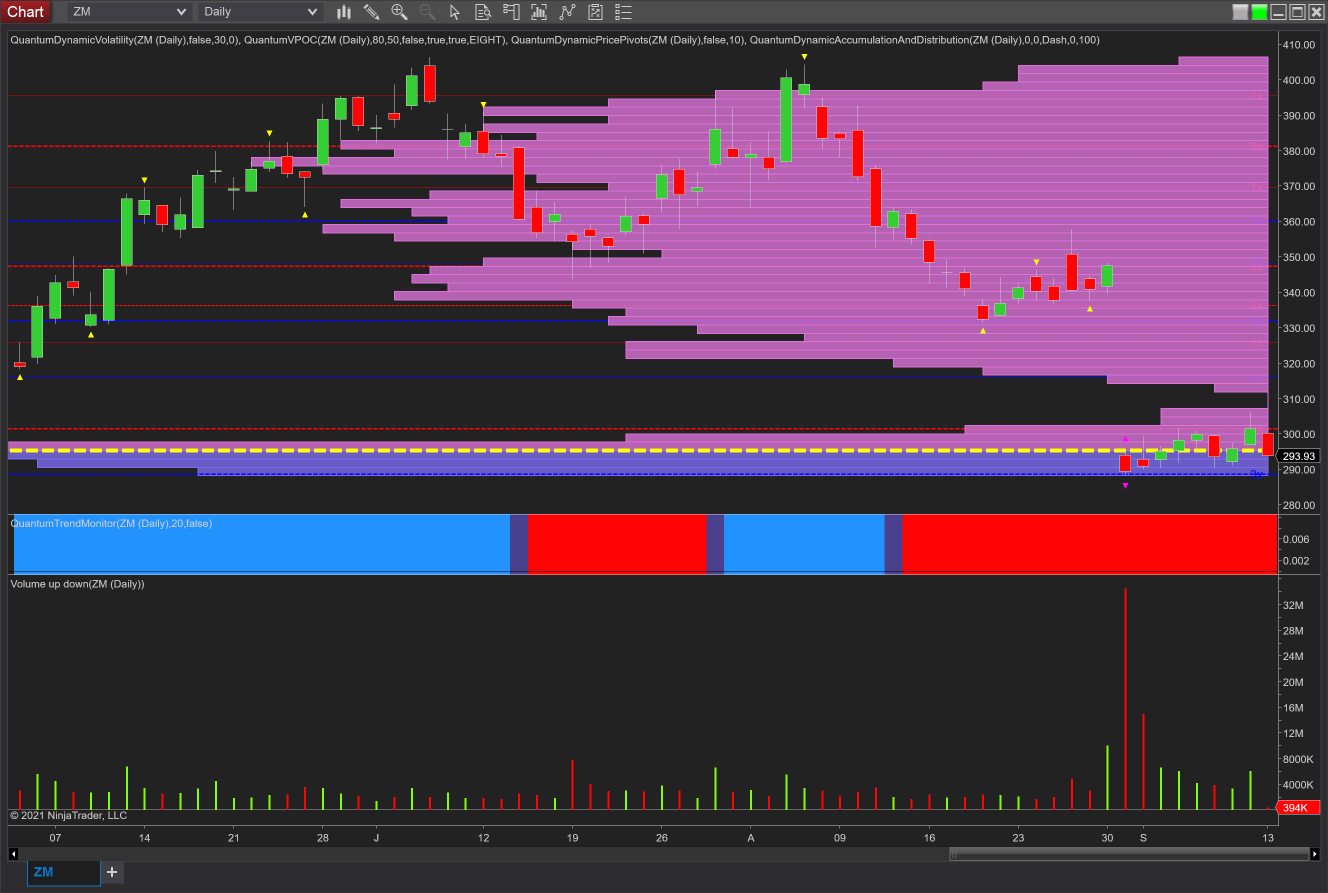
If we start with the daily chart, the double top created in the summer was enough to provide a signal of weakness, and whilst the volume is distorted by the extreme candle of the 31st August, it is still easy to see the trap move which occurred on the 4th August – an extremely widespread candle, but one which is not in agreement with the volume which looks far too low for such a move and so it proved to be. This is a classic trap, with hopeful buyers rushing in, not wanting to miss out on a strong rally, which then peters out the following day leaving them trapped in weak positions. Again, a classic example of a VPA anomaly. And so to the flash crash of the 31st August on extreme volume, for which there seems to be little in the way of explanation from analysts other than a worry about slowing growth as the need for remote working decreases. The dramatic gap down was supported with extreme volume as the price moved down to the VPOC as denoted with the yellow dashed line, and confirming, if any were needed, to expect congestion to follow at this level.
(Click on image to enlarge)
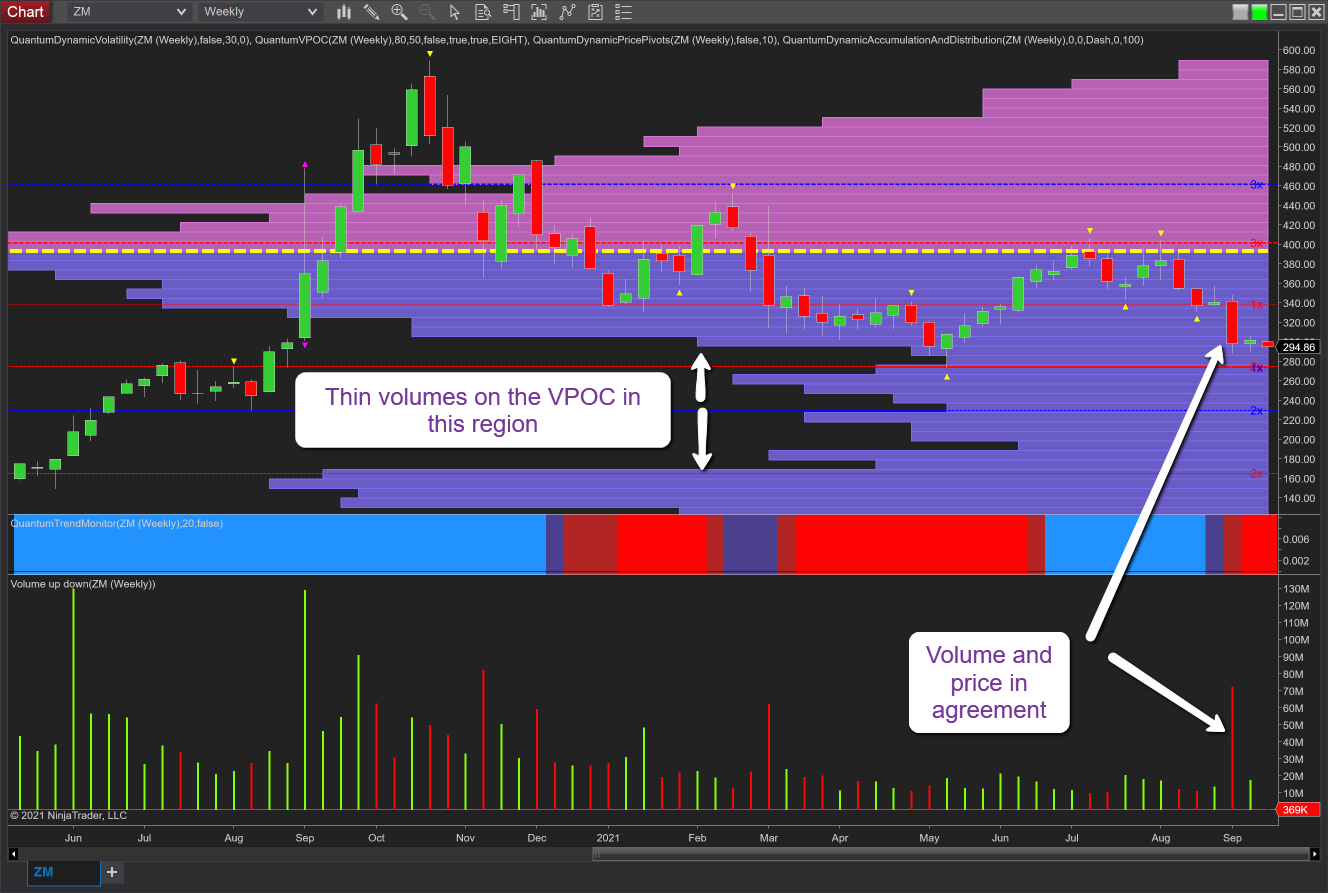
For the next part of the story, we need to move down to a slower timeframe which in this case is the weekly chart where a clearer picture emerges. Here the plunge in price is seen in the context of a widespread down candle on high volume confirming the longer-term weakness and where the downside looks ominous. Note that between $280 per share and $180 per share there is limited volume on the VPOC histogram which would provide little in the way of potential support from a volume perspective. Equally, the same is true of any price-based support with only minor levels on the accumulation and distribution indicator at $278 per share and $230 per share, before they join forces with volume at $165 per share.
(Click on image to enlarge)
So, in summary, this share looks structurally weak and as the pandemic is brought under control, this may trigger further weakness possibly down to $160 per share longer term. One final observation is the importance of using multiple time frames particularly when we have major gaps and extreme volume.
Disclaimer: Futures, stocks, and spot currency trading have large potential rewards, but also large potential risk. You must be aware of the risks and be willing to accept them in order to invest in ...
more


I hate seeing my stocks going down. But I’m fairly new to this, trying to be patient and still make the sound decision. It’s not easy!