
Once again, we find ourselves waiting on the all-important BLS labor report. The markets and the Fed are heavily dependent on the monthly BLS employment data; however, there are other labor market data sources that can provide a more frequent indication of labor market conditions. For instance, the weekly BLS data on jobless claims helps us appreciate the rate at which people are being laid off and how quickly those who were laid off in previous months have found jobs. Equally telling is the amount of withholding taxes the IRS receives on a daily basis.
The graph below shows the three-week moving average of the weekly dollar amount of IRS withholding taxes. Moreover, the withholding tax data is adjusted for wage growth. By doing so, we capture the change in taxes due to job gains or losses, rather than wage changes. The gap between 2023 and 2022 and 2024 and 2023 shows that IRS withholding tax collections increased at a good clip over those two years. Until about week 16, or the end of April of this year, a similar gap existed compared to 2024. However, that gap is closed as we highlight below. Moreover, the current reading is actually slightly less than the same week last year. We are careful not to read too much into the recent withholding tax data, but if the 2025 collections continue to run below those in 2024, it’s highly likely that job growth has halted or even declined.

What To Watch Today
Earnings
(Click on image to enlarge)
![]()
Economy
(Click on image to enlarge)

Market Trading Update
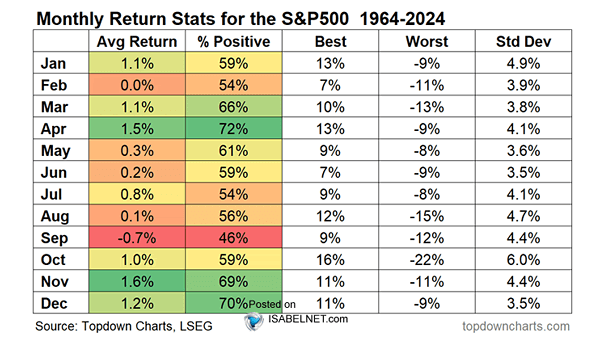
August turned out to be anything but typical for investors. Historically, the month is plagued by seasonal weakness, thinner liquidity, and heightened volatility as traders position ahead of September and Q3 earnings. Over the last 30 years, August has delivered some of the poorest monthly returns on average for the S&P 500. Yet in 2025, the index defied that history, grinding higher through the month and setting new intraday records above 6,500 before finishing at 6,452. The result was a modest gain for the month, but more importantly, it marked another milestone in an already extended rally.
Several key drivers helped markets overcome the seasonal drag. First, enthusiasm for artificial intelligence and related infrastructure remained a powerful tailwind. While semiconductor stocks wobbled late in the month, the earnings season still underscored the scale of corporate spending on AI capacity, which fueled flows into mega-cap leaders. Second, economic data leaned just supportive enough to keep the “soft-landing” narrative alive. A revised 3.3% GDP growth rate, steady jobless claims, and consumer spending that grew faster than income all suggested the U.S. economy continues to avoid recession. At the same time, July’s PCE inflation data cooled modestly, giving investors more confidence that the Federal Reserve could begin easing policy as soon as September. Third, global conditions, falling yields overseas, a softer U.S. dollar, and relatively calm energy markets, reinforced the idea that liquidity would remain abundant despite tariffs and trade disruptions.
The question is whether that resilience can hold in September, historically the weakest month of the year for equities. Valuations are stretched, breadth remains narrow, and Fed policy is still subject to incoming data. To sustain momentum, markets will need more than AI enthusiasm; they will require broader sector participation, continued progress on inflation, and labor market data that cools without cracking. Investors should remain alert to the risk that stretched positioning meets seasonal headwinds in the weeks ahead.
OUTLOOK: Neutral – August’s strength highlights resilient momentum, but narrow leadership, high valuations, and September’s seasonal risks argue for caution and selectivity.
Technical Backdrop
As noted, the market finished August in better shape than most investors expected, but the technical picture suggests that the rally is slowing. The S&P 500 ended the week at 6,460, within striking distance of record highs. From a trend perspective, the index remains in a strong uptrend: it sits comfortably above its 20-day moving average (~6,417), the 50-day (~6,316), and the long-term 200-day (~5,959). These moving averages act like “support floors” beneath prices where buyers have historically stepped in. The primary uptrend remains intact if the index holds above those markers. The good news is that money flows turned much more positive over the past week, again showing “dip buyers” stepping in after the pre-Jackson Hole decline.

That said, momentum indicators are starting to show fatigue. The Relative Strength Index (RSI), which measures whether stocks are overbought or oversold, has cooled to around 58, a more neutral reading, but most notably remains in a negative divergence from the rising market. Likewise, the stochastic oscillator, another momentum gauge, has dipped into oversold territory, which can sometimes precede a bounce but more often signals that the market’s short-term strength is waning. Lastly, the MACD, which tracks longer-term momentum, is still positive but losing steam and is also negatively diverging from the market. In plain English: the market trend is still upward, but the speed and conviction behind the move are fading.
Breadth, or the number of stocks participating in the rally, remains somewhat narrow. Mega-cap technology continues to do the heavy lifting, while much of the broader index has lagged. Historically, strong and sustainable rallies require broad participation, not just leadership from a handful of names. Without that, the market can be more vulnerable to sudden reversals if sentiment shifts against the leaders.
Putting this together: The market is still technically healthy, but it is running into the seasonal headwinds of September. With momentum indicators flashing signs of fatigue and the rally concentrated in fewer stocks, the risk of a pullback has risen. A modest decline toward the 50-day average near 6,316 would not be unhealthy, as it would help reset conditions and allow for a stronger foundation into year-end. However, such a pullback, while possible, would be painful, and this continues to argue for a risk management protocol.
OUTLOOK: Neutral – The trend remains positive. However, fading momentum and narrow leadership increase the odds of a short-term pullback or sideways consolidation before the market can make another leg higher.
The Week Ahead And PCE Prices
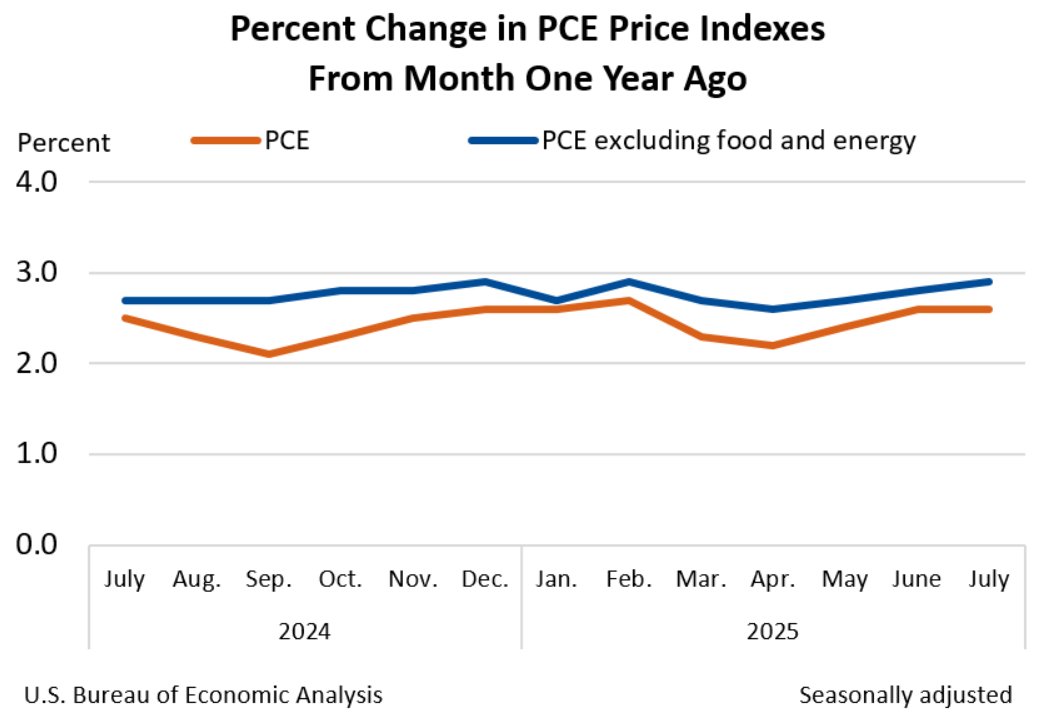
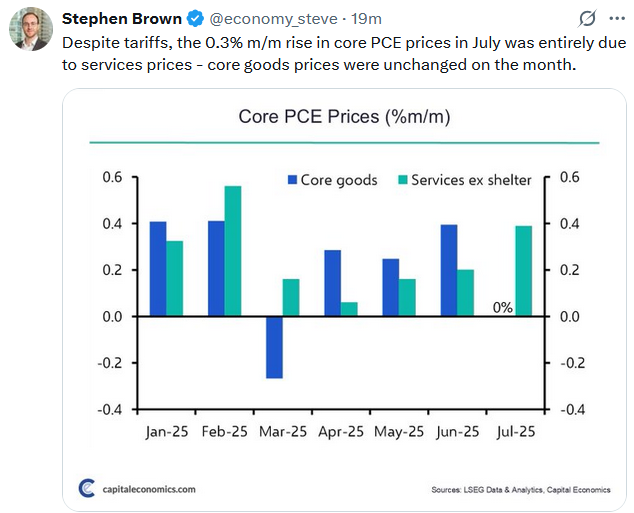
PCE prices came in as expected on Friday. The graph below shows that PCE prices, both headline and core, have remained relatively flat over the last year. The impact of tariffs has yet to have an impact on inflation data. Furthermore, check out the Tweet of the Day. It shows that PCE goods prices, which are most susceptible to tariffs, were flat for the month.
- PCE: 2.6% YoY vs. 2.6% est.
- PCE: 0.2% MoM vs. 0.2% est.
- Core PCE: 2.9% YoY vs. 2.9% est.
- Core PCE: 0.3% MoM vs. 0.3% est.
The holiday-shortened week will provide us with an updated look at the labor markets. JOLTS on Wednesday and ADP on Thursday will set the market’s expectations for Friday’s BLS data. Currently, the market expects the economy to have gained a modest 70,000 jobs in August, in line with last month’s 73,000. Bear in mind that the BLS sharply revised payroll growth lower for the prior two months in last month’s report. Thus, the average payroll growth for the previous three months is around 35k. Another weak employment reading is likely to leave the Fed with little doubt about cutting rates on the 17th. However, a hot CPI print on the 11th could cause some hesitation.
Energy Prices As An Economic Indicator
What are energy prices telling us about the economy? A recent article on Bloomberg noted that:
“Hedge funds slashed their bullish position on crude to the lowest in about 17 years as risks of additional sanctions on Russian crude oil waned, bringing concerns about a global supply glut back to the fore. Money managers’ net-long position on West Texas Intermediate shrank by 19,578 lots to 29,686 lots in the week ended Tuesday, data from the Commodity Futures Trading Commission show. That’s the lowest since October 2008.”

However, there is more to this story than just easing global tensions and rising oil supplies impacting energy prices. Energy prices indicate economic strength, or, in this case, weakness. If the global economy grew strongly, the need for oil consumption would rise, absorbing the current production levels, causing energy prices to rise. However, the outlook for economic growth in the major oil consumption economies, the U.S. and the Eurozone, is very weak.
Tweet of the Day
More By This Author:
Portfolio Risk Management: Accepting The Hard TruthMeme Markets: Investing Vs. Entertainment
Energy Price As An Economic Indicator


Comments
Log in or sign up to join the conversation.