Will This Week's Big Tech Earnings Be A Train Wreck?
Image Source: Unsplash
The market’s initial reaction to the Microsoft (MSFT - Free Report) report was negative, which made sense given the sluggish top-line growth pace and weak guidance. But sentiment on the numbers shifted as market participants realized that Microsoft’s cloud numbers were hardly the ‘train wreck’ that many had started fearing ahead of the release.
Broadly speaking, the market’s favorable reaction to the Microsoft results is in the same spirit with which it has received all incoming results in the Q4 earnings season.
Regular readers of our earnings commentary know that we have been referring to the overall picture emerging from the Q4 earnings season as good enough; not great, but not bad either. With results from more than 28% of S&P 500 members already out, we can confidently say that corporate earnings aren’t headed towards the ‘cliff’ that market bears were warning us of.
The way we see it, the ‘better-than-feared’ view of the Q4 earnings season at this stage may be a bit unfair, given how resilient corporate profitability has turned out to be. But the view isn’t entirely off the mark either.
We want to dwell on the Microsoft report a bit more given the read-through that its business provides us for broad trends in enterprise spending.
Microsoft’s business in the PC and ‘adjacent’ spaces validated the market’s ‘train wreck’ fears, with the view getting reconfirmed by another disappointing report from Intel (INTC - Free Report). But Microsoft has been far less about PCs and far more about cloud (Azure), and results on that front are good enough.
Azure growth of +38%, in constant-currency terms, beat consensus estimates by a hair. Management pointed to a notable deceleration as the quarter unfolded, with the growth pace in December 2022 in the mid-30 percentage range and they guided towards a bit lower growth pace for the March quarter.
These Azure trends are hardly abstract for the market, as they provide the setup for this week’s Amazon (AMZN - Free Report) and Alphabet (GOOGL - Free Report) results. Microsoft’s Azure is generally seen as the runner-up to Amazon Web Services, with Alphabet’s cloud offering as third in place. In addition to Alphabet and Amazon, we also have Apple (AAPL - Free Report) and Meta (META - Free Report)on the docket reporting results this week.
The chart below shows the one-year stock market performance of the Zacks Technology sector (the red line; down -18.8%), Apple (green line; -14.8%), Microsoft (blue line; -19.7%), Alphabet (purple line; -26.1%), Amazon (-29.5) and Meta (-49.9%).
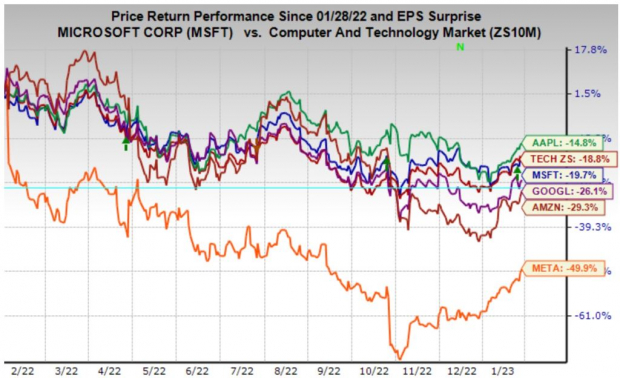
Image Source: Zacks Investment Research
The S&P 500 index, which we deliberately kept out of the above chart to reduce clutter in the visual, was down only -9.7% in the period.
These businesses aren’t exactly comparable, though digital advertising is core for Alphabet and Meta and to a smaller extent for Amazon. As noted earlier, Amazon is a leader in both the cloud as well as retail spaces, with the latter business facing capacity issues lately. And then there is Apple, which is in a league of its own.
Take a look at the chart below that shows current consensus expectations for this group for the current and coming periods in the context of what they were able to achieve in the preceding period.
We have highlighted the expected -11.7% earnings decline on +9.2% higher revenues for this group of 5 Tech leaders in 2022 Q2.
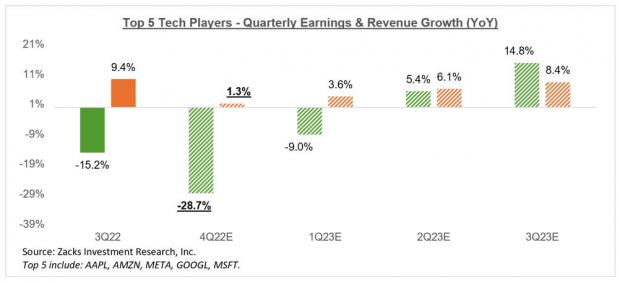
Image Source: Zacks Investment Research
As you can see here revenue growth is expected to remain in positive territory, with cost pressures weighing on earnings expectations. Needless to add that these Tech leaders are faced with compressed margins.
The chart below that shows the group’s earnings and revenue growth on an annual basis.
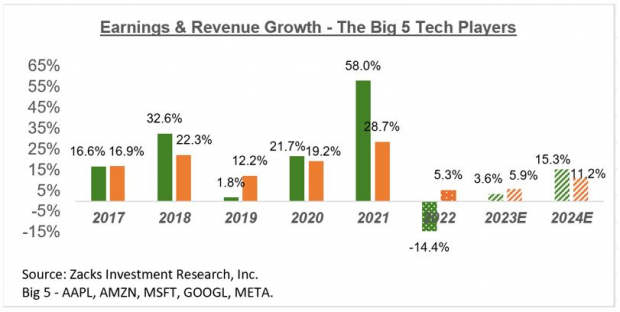
Image Source: Zacks Investment Research
Look at the chart and note the growth trend from 2022 to 2023. In other words, whether the growth trend for these companies is decelerating or not is a function of your holding horizon. These companies are impressive growth engines in the long run, even if those estimates for 2023 and 2024 come down in the days ahead.
As the macroeconomic clouds clear, as they eventually will, these digital platforms will be there to recapture those spending dollars.
Beyond the big 5 Tech players, total Q4 earnings for the Technology sector as a whole are expected to be down -18.5% from the same period last year on -2.6% lower revenues.
The chart below shows the sector’s Q4 earnings and revenue growth expectations in the context of where growth has been in recent quarters and what is expected in the coming four periods.
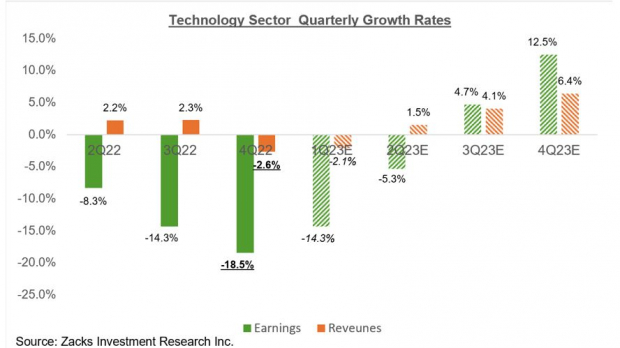
Image Source: Zacks Investment Research
2022 Q4 Earnings Season Scorecard
As of Friday, January 27th, we now have Q4 results from 143 S&P 500 members or 28.6% of the index’s total membership. Total earnings for these 143 index members are down -3.3% from the same period last year on +6.1% higher revenues, with 71.3% beating EPS estimates and 67.1% beating revenue estimates.
With 108 index members on deck to report Q4 results this week, we will have seen results from one-half of all the index members by the end of the week.
The comparison charts below put the EPS and revenue beats percentages in Q4 in a historical context.
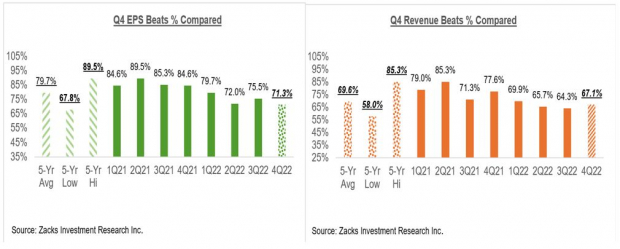
Image Source: Zacks Investment Research
The comparison charts below put the earnings and revenue growth rates in Q4 in a historical context.
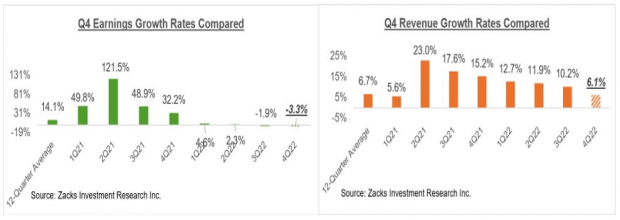
Image Source: Zacks Investment Research
The Earnings Big Picture
The chart below shows the expected 2022 Q4 earnings and revenue growth expectation in the context of where growth has been in recent quarters and what is expected in the next few quarters.
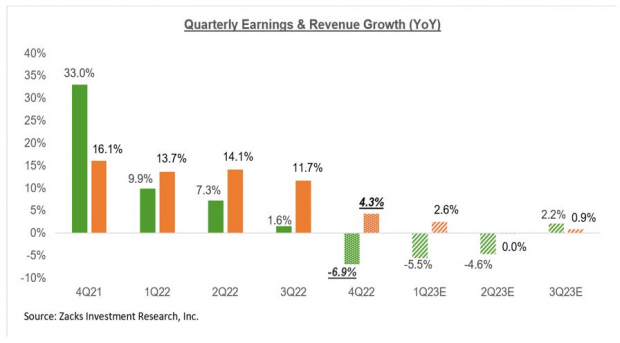
Image Source: Zacks Investment Research
The chart below shows the overall earnings picture on an annual basis.
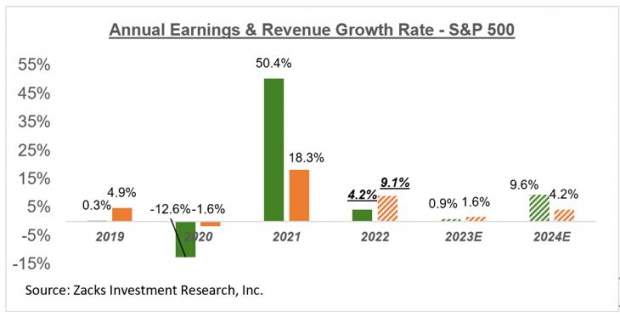
Image Source: Zacks Investment Research
Estimates for 2023 have been steadily coming down, as we have been flagging for some time now. You can see this in the chart below that shows how the aggregate earnings total for the index has evolved since the start of 2022.
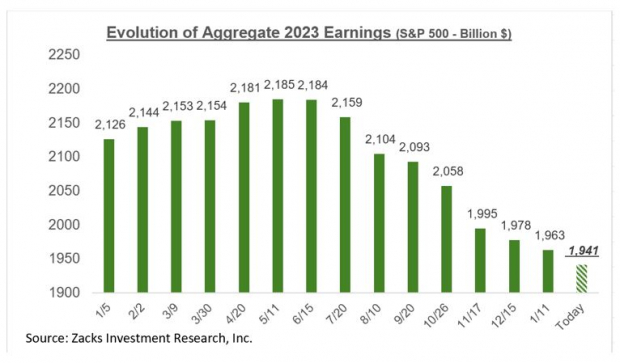
Image Source: Zacks Investment Research
Please note that the $1.941 trillion in expected aggregate earnings for the index in 2023 approximate to an index ‘EPS’ of $218.56, which compares to $216.89 in 2022.
The chart below shows this index ‘EPS’ has evolved since the start of 2022.
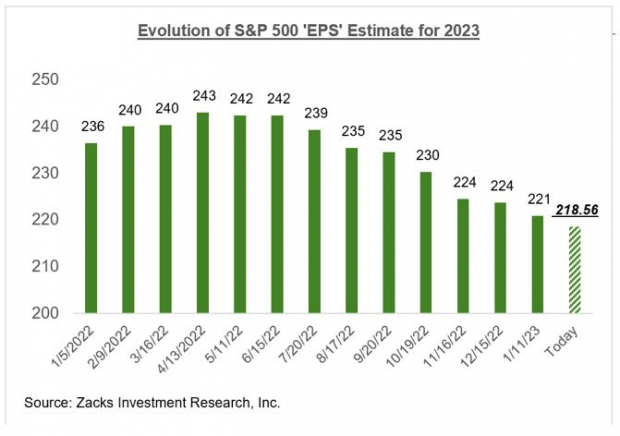
Image Source: Zacks Investment Research
From their peak in mid-April 2022, S&P 500 earnings estimates have been revised down by -10.8% for the index as a whole and by -12.92% on an ex-Energy basis, with much bigger cuts to estimates for the Construction, Consumer Discretionary, Retail, Tech and Aerospace sectors.
More By This Author:
Digging Into The Early Q4 Earnings Season Scorecard
Making Sense Of The Early Q4 Results: Is An Earnings Cliff Coming?
Plenty Of Positives In Big Bank Earnings: What's Next?
Disclosure: Zacks.com contains statements and statistics that have been obtained from sources believed to be reliable but are not guaranteed as to accuracy or completeness. References to any specific ...
more


