

Image Source: Pixabay
Today, we got some short-term positive price action in the PM complex, which could lead to a bigger move higher.
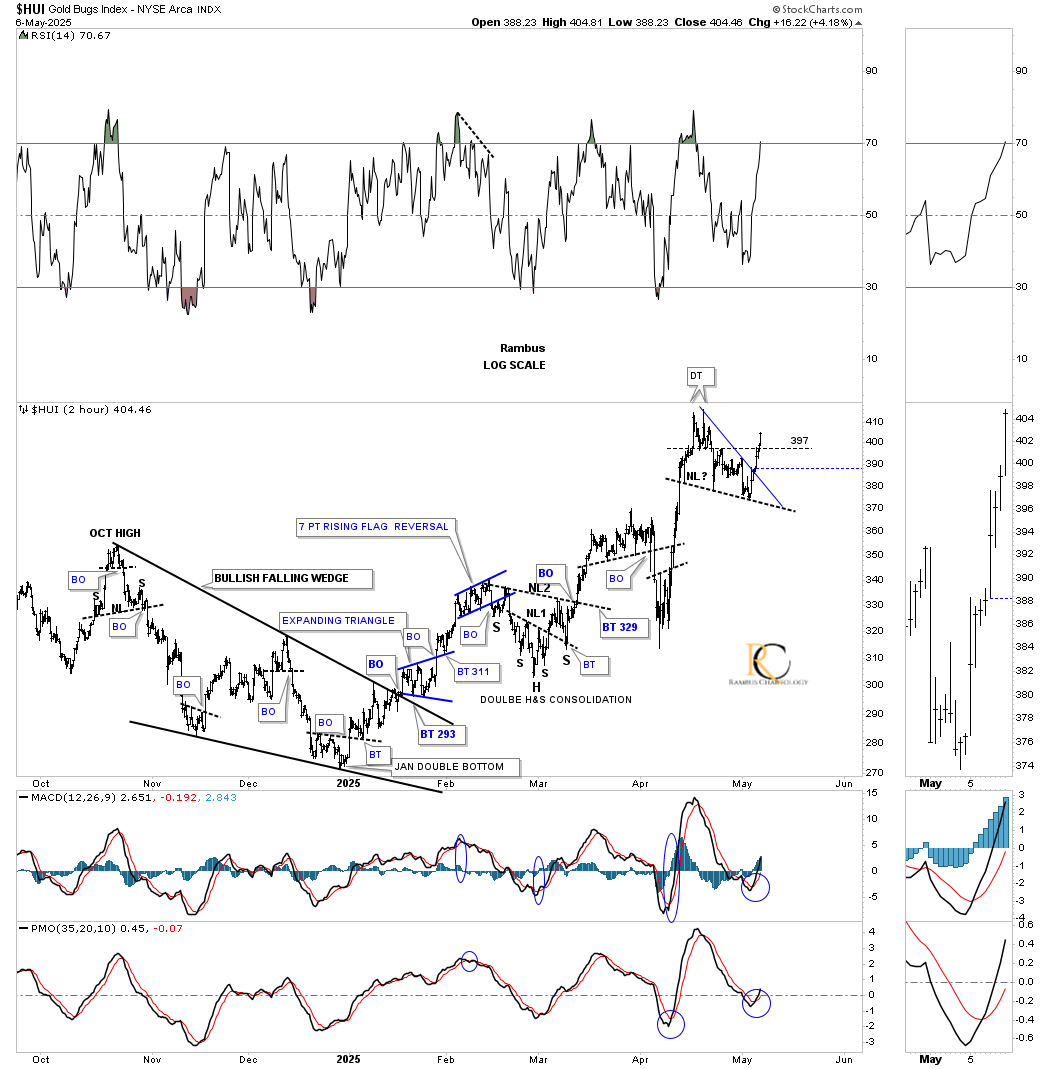
Let’s start with this 2-hour chart for the HUI, which shows all the small consolidation patterns since the October 2024 high. Last month, the HUI formed a micro double top high, which reversed the January rally. Since the breakout from the micro double top high, the price action has been drifting lower, and as of last Friday, a possible unbalanced H&S top was forming. Instead of confirming the H&S top on Monday, the HUI broke higher with more follow-through today, forming a possible bullish falling wedge.
Toward the end of the day, the HUI closed above the double top trendline, which was a positive development, taking out the first area of overhead resistance. Next, we’ll need to see the micro double top high exceeded for more confirmation, which is where I will add another round to the Kamikaze Portfolio. From this short-term perspective, the HUI could still be forming a larger sideways trading range, with the micro double top and recent low being reversal points 1 and 2, with the 3rd reversal point now underway toward the previous double top. We would then need to see one more decline to put in the all-important 4th reversal point to complete the consolidation pattern if the falling wedge is part of a bigger trading range. If the falling wedge is a standalone pattern, then the 4th reversal point is already in place, with a breakout above the double top high confirming that pattern.
Next is the short-term 2-hour chart showing the bullish rising wedge with the falling wedge forming the backtest. Today we got the breakout above the top trendline and close above the double top trendline which is positive. Again, the last step is to see the double top high taken out to confirm the October 2024 bullish rising wedge is complete.
More By This Author:
Market Update: CDNX Breaks Out, Energy Complex In Backtest Mode Ahead Of Potential Decline.Decoding The Precious Metals Charts: A Bullish Outlook
Precious Metals Complex Impulsing Higher


Comments
Log in or sign up to join the conversation.