Why Are Stocks Moving Lower?

Image Source: Pixabay
Are stocks finally coming out of the irrational exuberance they were suffering from this year, or is the pullback in the market only a temporary and passing phase that primarily reflects the absence of any meaningful near-term catalysts that can help sustain its earlier momentum?
I find myself in the latter camp, with the better-than-expected June-quarter earnings reporting cycle now effectively behind us - more on that a little later in this note – and the steady flow of positive economic readings pushing the ‘recession-is-coming’ crowd into retreat.
The recent uptrend in treasury yields is a legitimate point of concern. But I see it as more reflective of renewed economic resilience than a reassessment of what the Fed will or will not do going forward.
Even if the Atlanta Fed’s GDPNow tracker of +5.8% growth estimate for the current period proves to be too optimistic, and the actual growth pace proves to be around half that level where the consensus is, it is still magnitudes better than what anyone would have expected six, nine, or twelve months back. The U.S. economy’s performance has been nothing less than spectacular, particularly given how much the central bank has tightened monetary policy in this cycle.
Higher interest rates and mortgage rates are undoubtedly a headwind for the market. Still, many stocks will thrive even in a high-rate environment if the driver for higher rates is economic growth and positive momentum.
We will see what the Fed chief says at Jackson Hole, but the market doesn’t seem to have an issue with another rate hike. The way I see it, the big point of uncertainty at present is the duration of ‘higher-for-longer’, meaning a tentative timeline for when the Fed will start cutting rates. Perhaps Jackson Hole will help provide some clarity on that question.
On the earnings front, we provide the scorecard and other details below, but this earnings season has been another example of the continued resilience and stability of the U.S. consumer. We heard this from the banks, the leisure and hospitality players, and consumer-facing digital and traditional operators.
There is undoubtedly stress at the lower end of income distribution, and one can intuitively project moderation in consumer spending as the economy further slows down under the weight of tighter monetary conditions. However, one is at a loss to see that in current estimates of GDP growth.
Inflation may be down from the multi-decade highs of a few quarters back, but it still remains a headwind, particularly for the lower end of income distribution. Other issues, like the resumption of student loan payments, are seen as weighing on spending trends. That said, the labor market remains very strong, with wages still going up.
It is hard to envision any meaningful consumer spending slowdown without a labor market crackup.
Q2 Earnings Scorecard (As of Friday, August 18th)
The Q2 reporting cycle is effectively over now, with results from 473 S&P 500 members, or 94.5% of the index’s total membership, already out.
We have over 100 companies reporting results this week, including 12 S&P 500 members. Ulta Beauty (ULTA - Free Report) and Lowe’s (LOW - Free Report) are among this week’s notable companies reporting results this week. Still, the most consequential company on deck to report results is Nvidia (NVDA - Free Report), which will report after the market’s close on Wednesday, August 23rd.
Nvidia’s last earnings release on May 24th was one for the record books, with the magnitude of the guidance upgrade unlike any we have seen in the past. The stock is up +41.1% since the May 24th release, which compares to the Tech sector’s +5.2% gain and the S&P 500 index’s +5.6% rise in the same time period. The stock has effectively become a play on the AI trend.
Nvidia shares are down -7.4% this month, roughly in-line with the Tech sector’s -7.3% decline but lagging behind the market’s -4.6% decline. This recent underperformance notwithstanding, the stock is up +196.2% this year, massively outperforming the Zacks Tech sector (up +32.7%) and the S&P 500 index (up +15.2%).
Estimates for the quarter doubled following the aforementioned guidance, with the current $2.06 per share estimate up $1.04 per share three months ago. Estimates for Q4 and full-year 2024 similarly went up sharply.
Given its performance since the last quarterly release, the stock is under a spotlight as it comes out with July-quarter numbers and discusses trends about the coming periods. The market is trying to handicap whether the May 2023 report was a one-off or the start of a new trend.
That’s a lot of pressure to handle, but Nvidia has a history of thriving under such conditions.
Returning to the 473 S&P 500 members that have reported already, total Q2 earnings for these companies are down -8.5% from last year on +0.91% higher revenues, with 79.5% beating EPS estimates and 65.8% beating revenue estimates.
The comparison charts nevertheless put the Q2 results from these 473 index members with what we had seen from the same group of companies in other recent periods.

Image Source: Zacks Investment Research
The comparison charts below put the Q2 earnings and revenue growth rates for these 473 index members in a historical context.

Image Source: Zacks Investment Research
With respect to the Retail sector 2023 Q2 earnings season scorecard, we now have results from 25 of the 33 retailers in the S&P 500 index.
Regular readers know that Zacks has a dedicated stand-alone economic sector for the retail space, which is unlike the placement of the space in the Consumer Staples and Consumer Discretionary sectors in the Standard & Poor’s standard industry classification. The Zacks Retail sector includes not only Walmart, Target, and other traditional retailers but also online vendors like Amazon (AMZN - Free Report) and restaurant players.
Total Q2 earnings for these 25 retailers that have reported are up +28.9% from the same period last year on +6.2% higher revenues, with 80% beating EPS estimates and 56% beating revenue estimates.
The comparison charts below put the Q2 beats percentages for these retailers in a historical context.

Image Source: Zacks Investment Research
With respect to the earnings and revenue growth rates, we like to show the group’s performance with and without Amazon, whose results are among the 25 companies that have reported already. As we know, Amazon’s Q2 earnings were up +526% on +10.8% higher revenues, as it beat top and bottom-line expectations.
As we all know, digital and brick-and-mortar operators have been converging for some time now. Amazon is now a decent-sized brick-and-mortar operator after Whole Foods, and Walmart is a growing online vendor. This long-standing trend got a huge boost from the Covid lockdowns.
The two comparison charts below show the Q2 earnings and revenue growth relative to other recent periods, both with Amazon’s results (left side chart) and without Amazon’s numbers (right side chart).

Image Source: Zacks Investment Research
The Earnings Big Picture
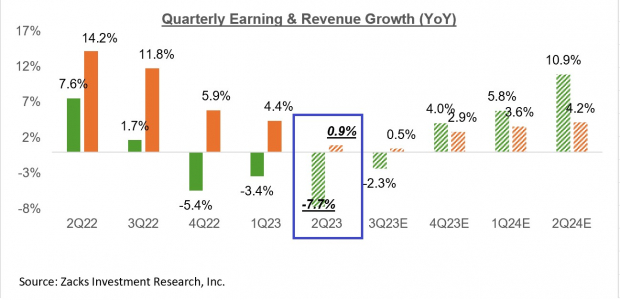
The chart below shows current earnings and revenue growth expectations for the S&P 500 index for 2023 Q2, the following three quarters, and actual results for the preceding four quarters.

Image Source: Zacks Investment Research
Please note that the -7.7% decline for Q2 earnings on +0.9% higher revenues is the blended growth picture for the quarter, which combines the actual results that have come out with estimates for the still-to-come companies.
As you can see in this chart, Q2 is on track to be the third consecutive quarter of earnings declines and the first quarter of declining revenues. As noted earlier, a big part of the earnings and revenue weakness is due to the Energy sector.
Excluding the Energy sector drag, Q2 earnings would be down -1.6% on +4.7% higher revenues.
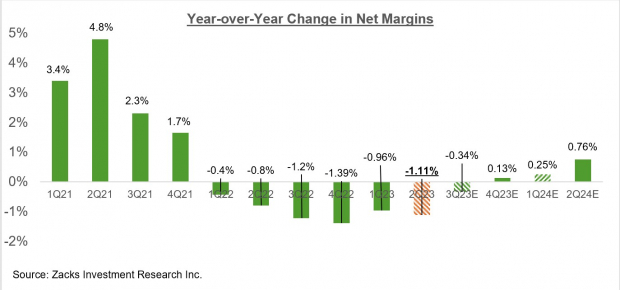
The chart below shows the year-over-year change in net income margins for the S&P 500 index.

Image Source: Zacks Investment Research
As you can see above, 2023 Q2 will be the 6th quarter in a row of declining margins for the S&P 500 index.
Margins in Q2 are expected to be below the year-earlier level for 7 of the 16 Zacks sectors, with the biggest margin pressure expected to be in the Energy, Medical, Basic Materials, and Construction sectors.
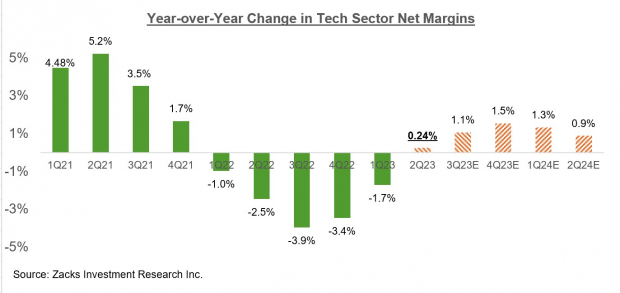
With the earnings focus lately on the Tech sector, it is instructive to see how much distance has been covered on the margins front in this key sector.

Image Source: Zacks Investment Research
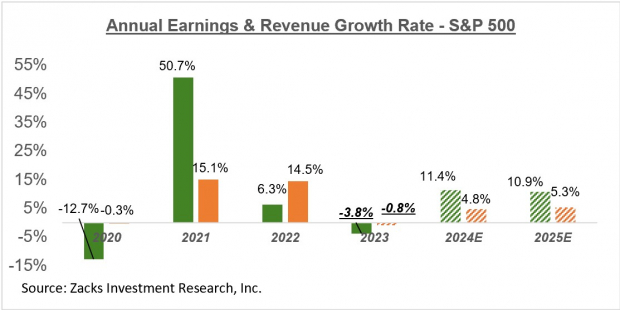
The chart below shows the earnings and revenue growth picture on an annual basis.

Image Source: Zacks Investment Research
More By This Author:
Q2 Earnings Confirm Improving Growth Trends
Retail Earnings Looming: What To Expect
Tech Sector's Earnings Outlook Reflects Improvement
Disclosure: Zacks.com contains statements and statistics that have been obtained from sources believed to be reliable but are not guaranteed as to accuracy or completeness. References to any specific ...
more


